

There is a free currency API called Fixer IO https://fixer.io/
You can connect to it by generating an API key and generating an account is free.
The documentation can be found here https://fixer.io/documentation
This guide is for learning how to set up a REST data source, how to generate dynamic values from SQL queries, and how to use additional parameters for your calls to get different info out of it.
Content
Set up Fixer IO account
Start by going to the webpage and clicking on Get Free API Key. Subscribe to the free plan. Once you have set up your account you will be asked to log in and here you can see the API access key. Copy it for future use.
Notice that on the free plan, you have 1000 calls per month.
Setup Common settings
Create a new TimeXtender REST data source.
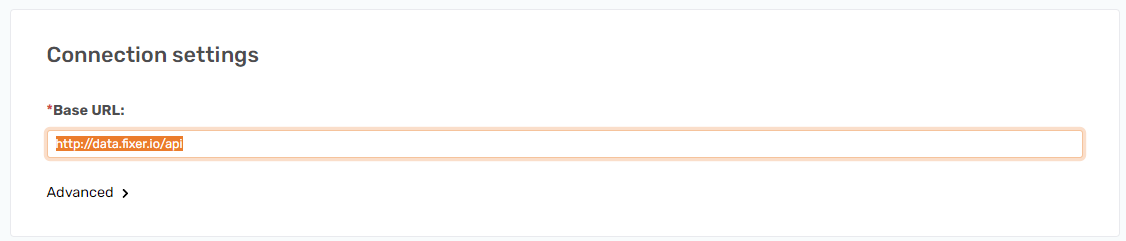
Give it a name such as Fixer and apply http://data.fixer.io/api to the Base URL field.
Setup Request limits
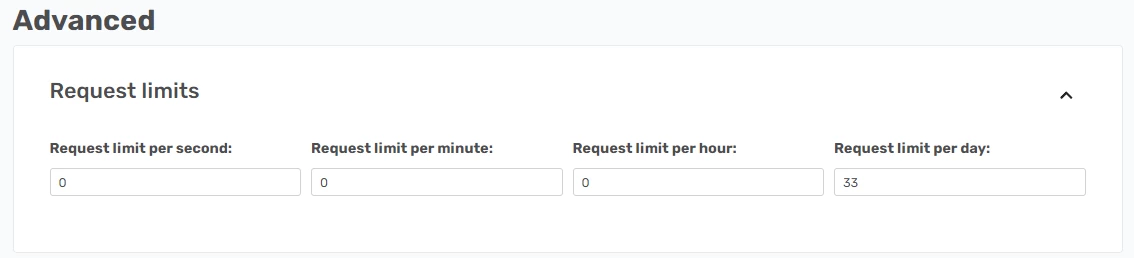
Under Advanced you can see the Request Limits section click on the downward arrow to expand it. There is a limit of 1000 requests per month, you can keep it empty, but if you were to imagine this running for real adding a value of 33 to the day option would limit it to avoid using up all calls too fast.
Setup endpoints
Here below are some of the endpoints and how you can use them.
Latest - Gives today's rates and shows how to apply parameters
This endpoint has the following options.
https://data.fixer.io/api/latest
    ? access_key = API_KEY
    & base = USD
    & symbols = GBP,JPY,EUR
The base and symbols parameters are optional and if they aren’t added they will default to give all currency types and set the base to USD.
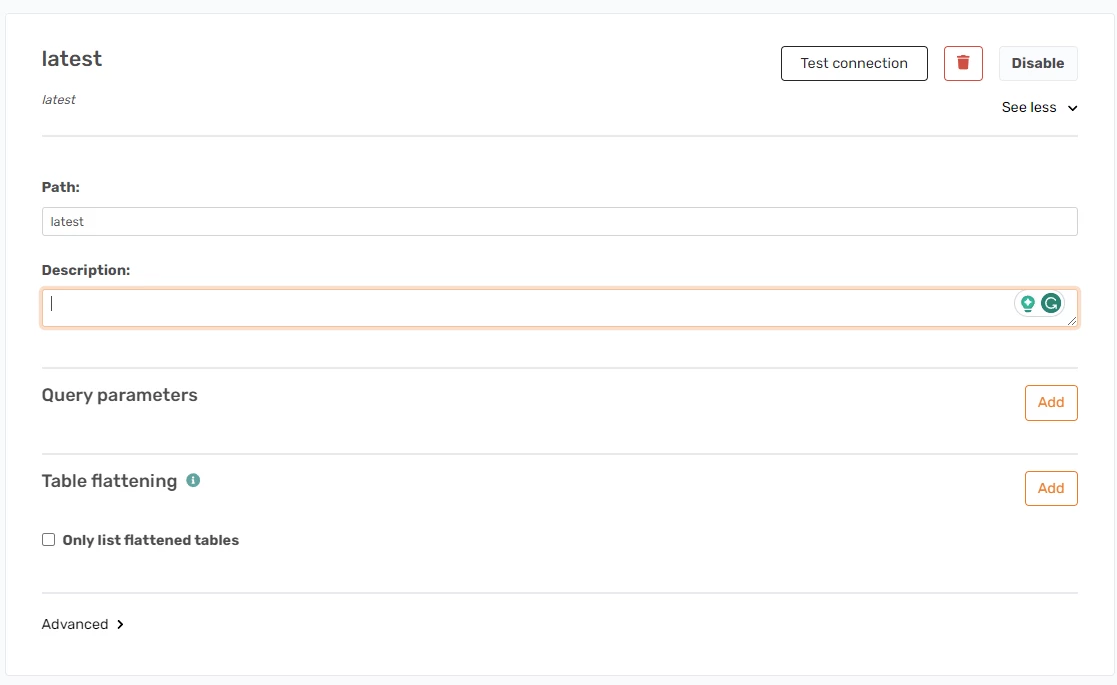
To set this up start by adding latest to a new endpoint and click Add endpoint. It will look like this
To add the parameters click Add on the button next to where it says Query parameters
Then add access_key, base, and symbols like so.
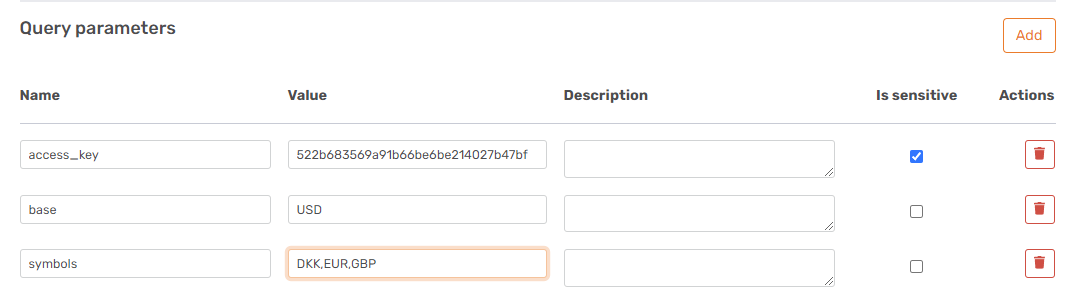
I checked the Is sensitive option for the access_key parameter this means that when you preview this in the future it will be a hidden value.
Expand the Advanced area and add a check to the Use endpoint name as schema name option.
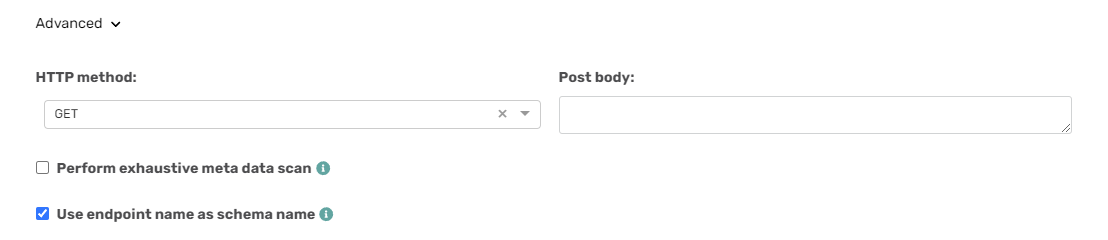
This is done because it returns the same rates name for the table no matter what endpoint is used. So applying this will give it the latest.rates name.
Save the changes to apply this endpoint, and synchronize the data source in the Ingest Instance to see it.
Yesterday - Gives historical rates based on a specific date. Uses SQL query to dynamically apply yesterday as the date
You can add historical data by applying a date as the endpoint.
https://data.fixer.io/api/2013-12-24
    ? access_key = API_KEY
    & base = GBP
    & symbols = USD,CAD,EUR
For example like so.
You can make this dynamic by using dynamic values. In this case, an SQL query could apply a date in the yyyy-mm-dd format it requests. I made this query, which returns yesterday's date in that format.
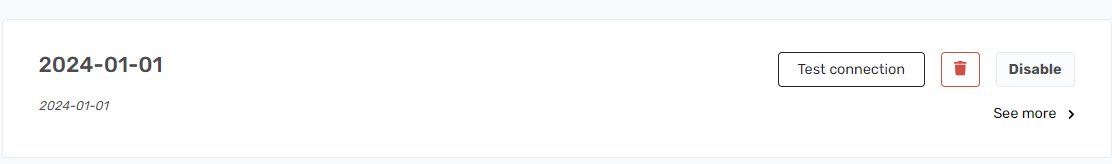
SELECT CONVERT(varchar(10),GETDATE()-1,23) AS yesterdayI will use that as an endpoint, so I type {yesterday} in the path field, make sure the name is yesterday, and click add endpoint.
As before I make sure the access_key parameter is set and that the Use endpoint name as schema name options are set.
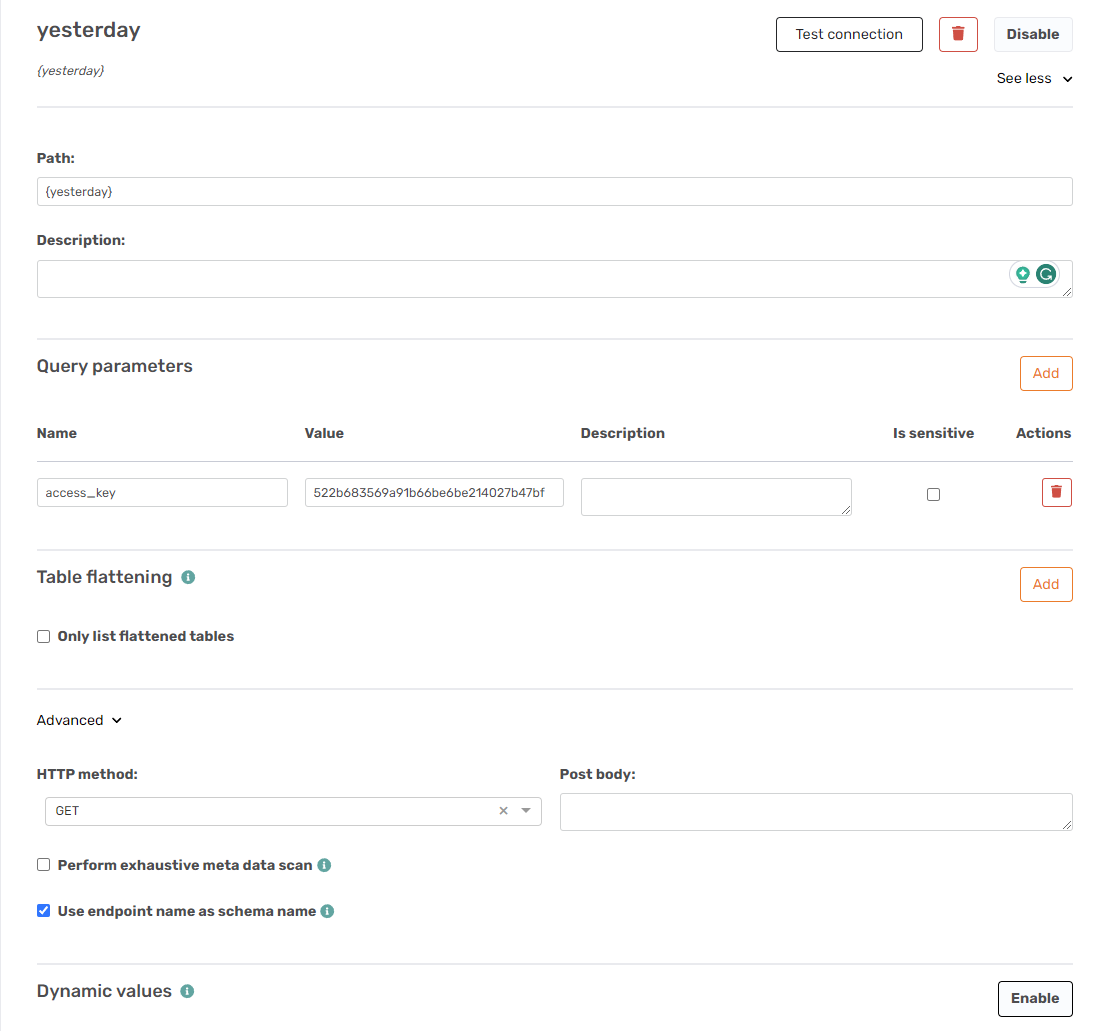
Then I click on Enable in the Dynamic values area.
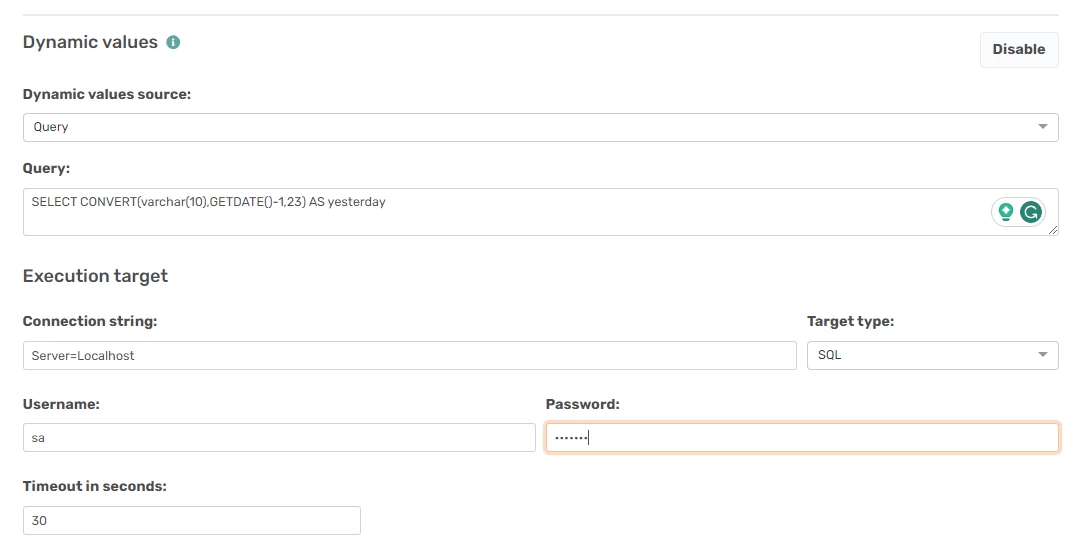
I apply the query in the Query area, in the Execution target area there is a Connection string field here I point at a SQL server name accessible from the server where the TimeXtender Ingest Server service is installed. I have one locally installed so I add Server=Localhost. It defaults to using SQL authentication, so I added an SQL user account in the Username field and its password in the Password field.
The target type could also be a Snowflake server if you have access to that, but here I use normal SQL.
This is all that is needed to get this value applied. The important part is that the query gives back a date in the correct format, that it has a name, and that the path is this name in curly brackets {}.
Save and synchronize to see the result.
Timeseries - Gives historical rates based on a start and end date. Uses SQL query to generate dynamic dates
There is a timeseries endpoint as well. This will return multiple dates and the rates for each based on a start and end date parameter.
https://data.fixer.io/api/timeseries
    ? access_key = API_KEY
    & start_date = 2012-05-01
    & end_date = 2012-05-25
So to set that up you can create the parameters as so.
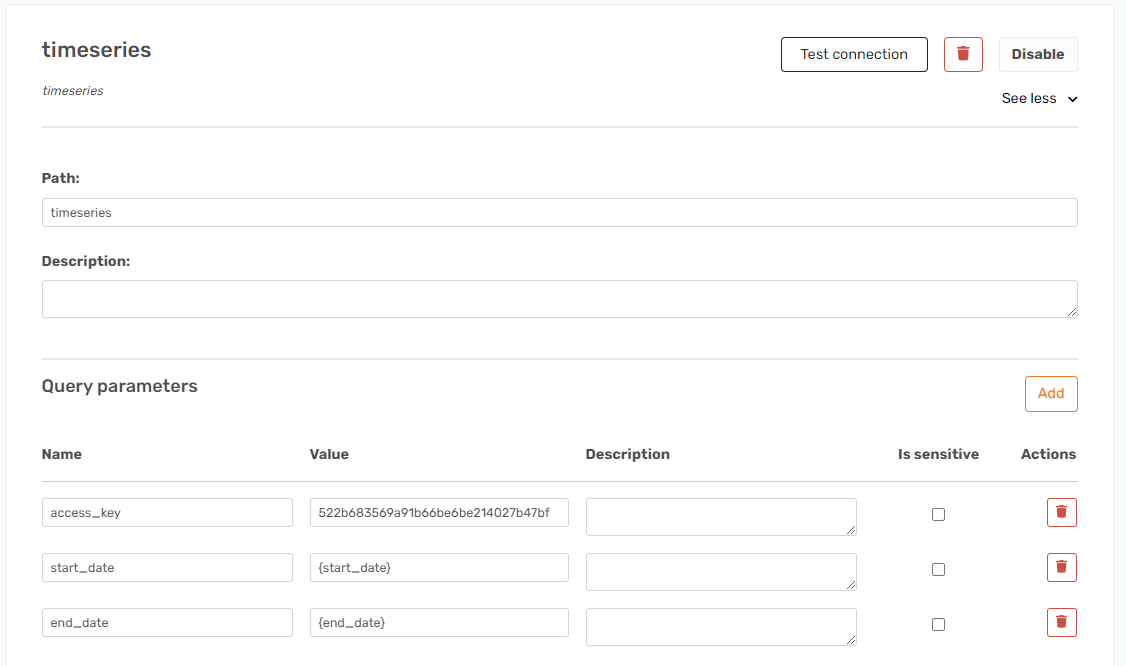
Notice that the parameter values are the same as the name only in curly brackets.
I then created the following query to get the parameters set. I decided on a 31-day range ending two days ago as I already got this day and yesterday.
SELECT
CONVERT(varchar(10),GETDATE()-32,23) AS start_date,
CONVERT(varchar(10),GETDATE()-2,23) AS end_date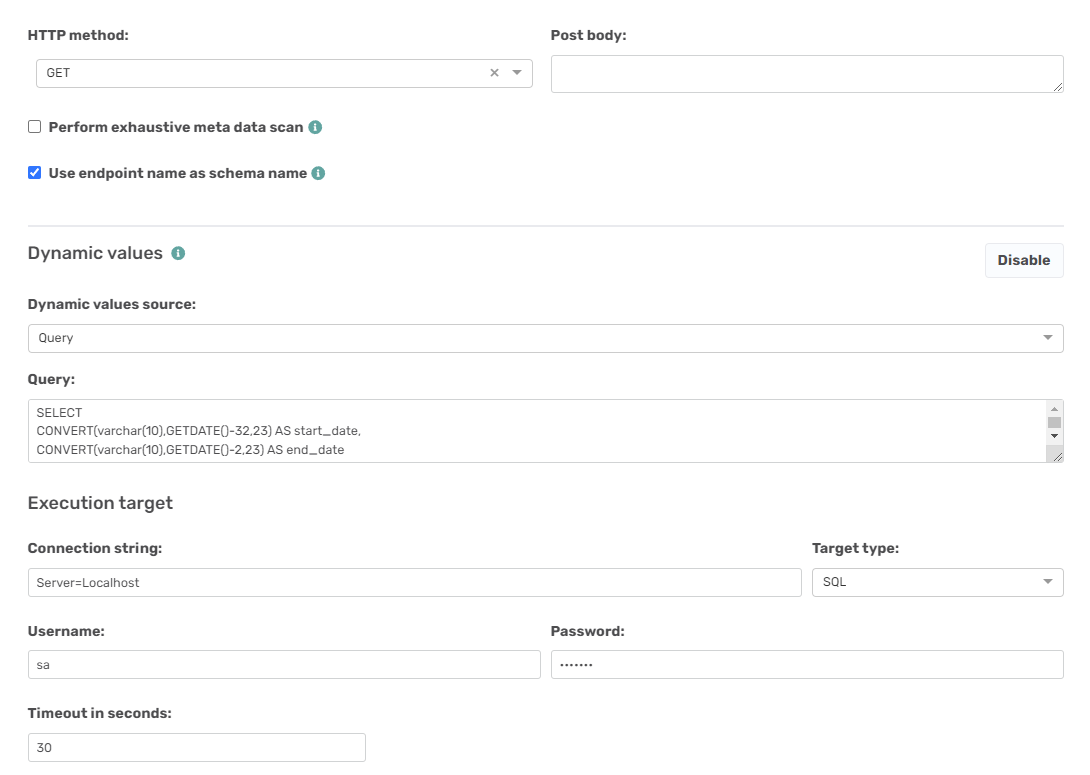
Unfortunately, this part is not available for the free plan, so I can’t 100% say it will work, but this is how it is supposed to be set up.
Custom range endpoint - Use a function in DW Instance to generate a range of dates to loop through
As you can see above it is not allowed to run the above unless you pay for the use of the Fixer API.
I did come up with a workaround. The requirement for this is that you need to use an existing Prepare instance database.
I could not find a way to generate the method to get the range of dates in a single SQL query, so what I did instead was add a function in the landing data area of my Prepare instance.
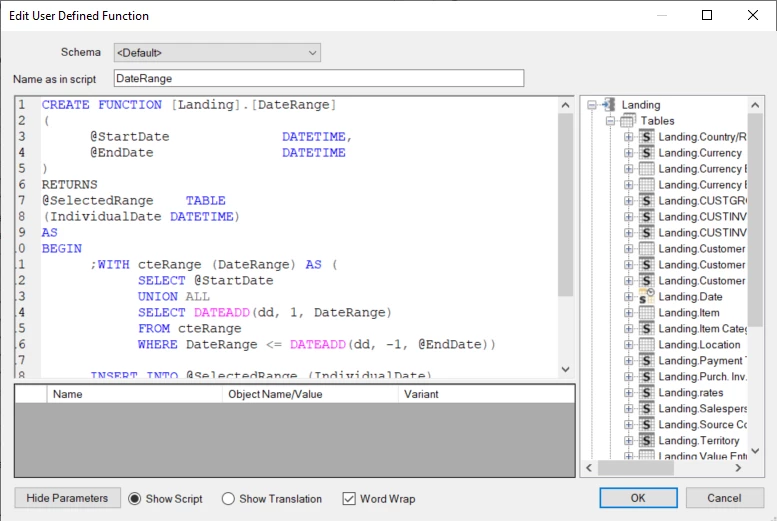
The function script looks like this
CREATE FUNCTION [Landing].[DateRange]
(
      @StartDate              DATETIME,
      @EndDate                DATETIME
)
RETURNS
@SelectedRange    TABLE
(IndividualDate DATETIME)
AS
BEGIN
      ;WITH cteRange (DateRange) AS (
            SELECT @StartDate
            UNION ALL
            SELECT DATEADD(dd, 1, DateRange)
            FROM cteRange
            WHERE DateRange <= DATEADD(dd, -1, @EndDate))

      INSERT INTO @SelectedRange (IndividualDate)
      SELECT DateRange
      FROM cteRange
      OPTION (MAXRECURSION 3660);
      RETURN
END
I applied it like so. First I added a new function.
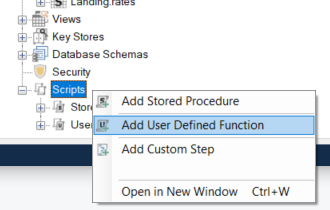
Then I applied the above script to it and deployed the function.
Then I made my endpoint look like this.
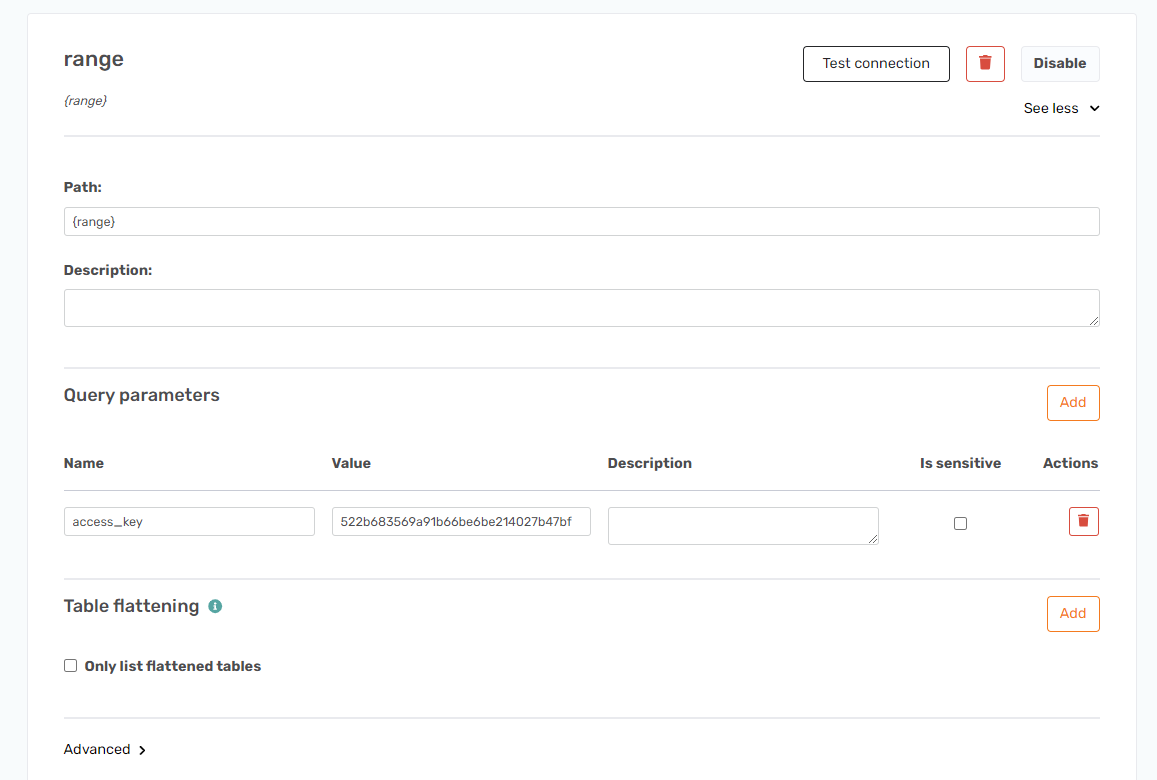
Notice the {range} path, this is what we are going to apply.
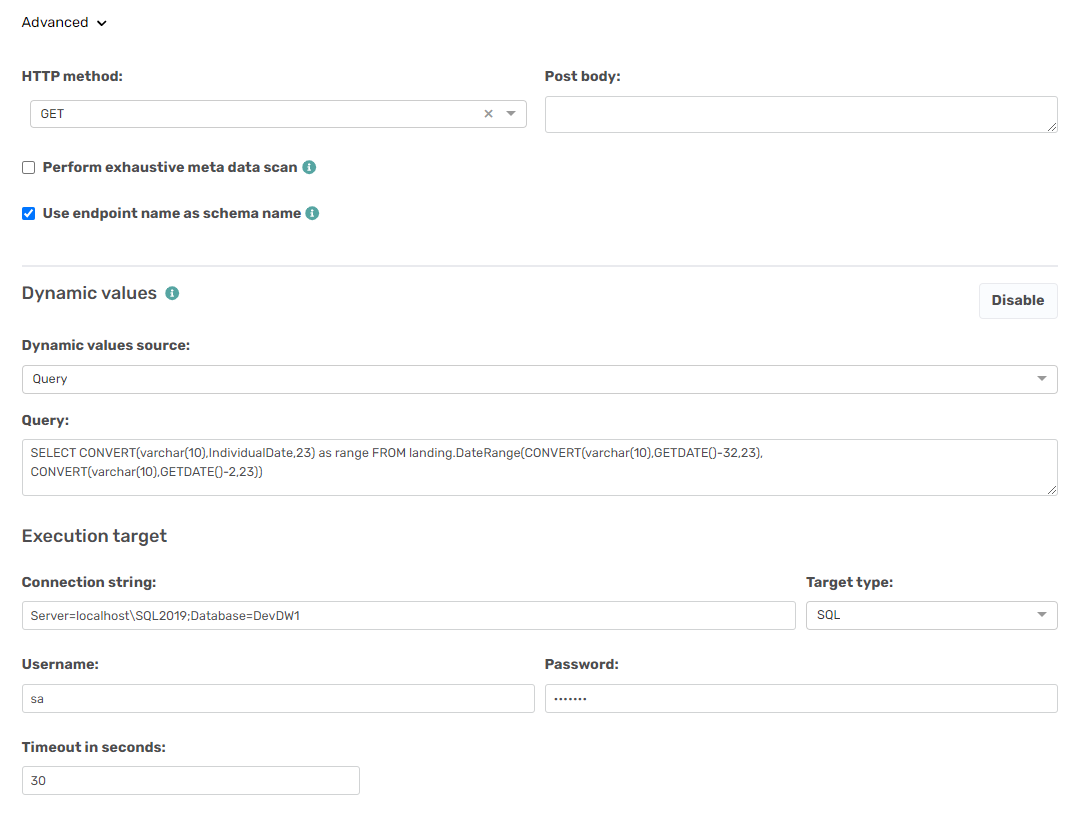
Then I added a query that refers to the function I made in my DW instance.
SELECT
CONVERT(varchar(10),IndividualDate,23) as range
FROM Landing.DateRange(CONVERT(varchar(10),GETDATE()-32,23),CONVERT(varchar(10),GETDATE()-2,23))
It uses the DateRange function which requires a start and stop date. I chose the same setup as for the Timeseries endpoint, so it is the last 31 days.
To call this function I had to make my connection string a bit more specific, so I changed it to look like this.
Server=localhost\SQL2019;Database=DevDW1
It now points to a specific server instance and to the specific Prepare instance database.
The setup looks like this.
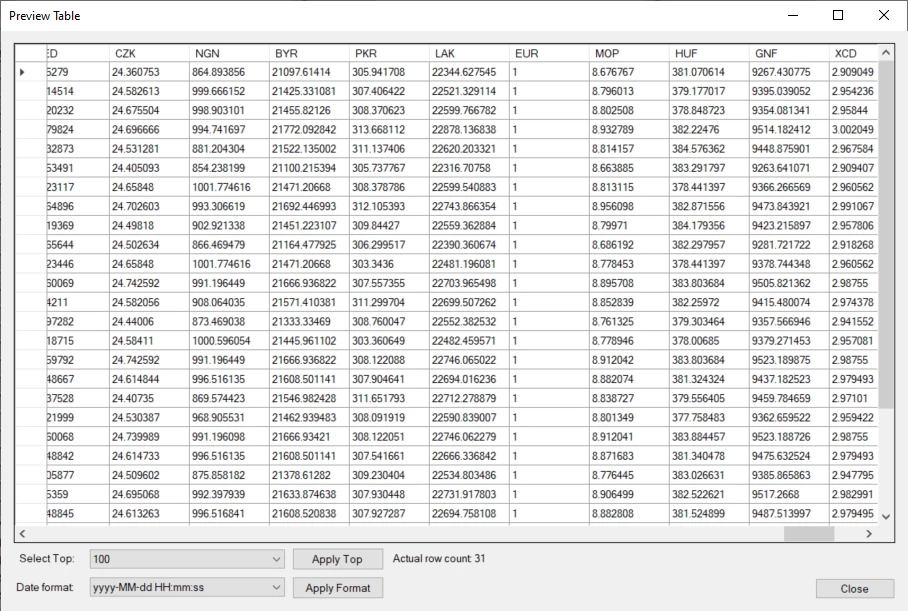
Saving, synchronizing, and running the transfer task gives the following result.
Use XLS to do table flattening
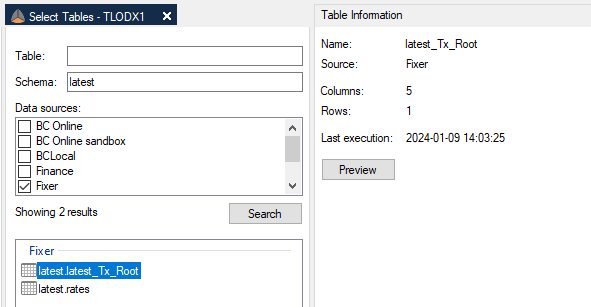
There is a split of the result for this. So if you connect to the latest endpoint you will get the following two tables.
latest_TX_Root and rates.
This happens because the XML/JSON data is structured like so.
<?xml version="1.0" encoding="utf-8"?>
<TX_Autogenerated_Root>
	<TX_Autogenerated_Element>
		<success>true</success>
		<timestamp>1704808983</timestamp>
		<base>EUR</base>
		<date>2024-01-09</date>
		<rates>
			<AED>4.019617</AED>
			<AFN>77.251937</AFN>
			<ALL>104.463754</ALL>
            ...
            <ZWL>352.405194</ZWL>
		</rates>
	</TX_Autogenerated_Element>
</TX_Autogenerated_Root>
This means that rates only contain that and no date explaining what date the rates are from. Between the two there is a TX_Autogenterated_Element_Id field that both tables share, but for this, they will always generate a 0 value. So merging all the endpoints will be impossible.
This is where the table flattening feature can help. It is also explained in the main guide and here, but this is what this is based on.
The setup is generally always the same.
You got the initial first template tag, which looks like this.
<xsl:stylesheet version="1.0" xmlns:xs="http://www.w3.org/2001/XMLSchema" xmlns:xsl="http://www.w3.org/1999/XSL/Transform">
  <xsl:output method="xml" indent="yes" />
  <xsl:template match="/">
    <xbi_root>
      <xsl:apply-templates select="/TX_Autogenerated_Root/TX_Autogenerated_Element/rates" mode="rows" />
    </xbi_root>
...
</xsl:stylesheet>
and then you get the second template where you add the fields you want.
<?xml version="1.0" encoding="UTF-8" ?>
<xsl:stylesheet version="1.0" xmlns:xs="http://www.w3.org/2001/XMLSchema" xmlns:xsl="http://www.w3.org/1999/XSL/Transform">
<xsl:output method="xml" indent="yes" />
<xsl:template match="/">
<xbi_root>
<xsl:apply-templates select="/TX_Autogenerated_Root/TX_Autogenerated_Element/rates" mode="rows" />
</xbi_root>
</xsl:template>
<xsl:template match="/TX_Autogenerated_Root/TX_Autogenerated_Element/rates" mode="rows">
<mixRates>
<xsl:element name="ALL">
<xsl:value-of select="ALL" />
</xsl:element>
<xsl:element name="DKK">
<xsl:value-of select="DKK" />
</xsl:element>
<xsl:element name="EUR">
<xsl:value-of select="EUR" />
</xsl:element>
<xsl:element name="GBP">
<xsl:value-of select="GBP" />
</xsl:element>
<xsl:element name="AUD">
<xsl:value-of select="AUD" />
</xsl:element>
<xsl:element name="SEK">
<xsl:value-of select="SEK" />
</xsl:element>
<xsl:element name="JPY">
<xsl:value-of select="JPY" />
</xsl:element>
<xsl:element name="ISK">
<xsl:value-of select="ISK" />
</xsl:element>
<xsl:element name="CAD">
<xsl:value-of select="CAD" />
</xsl:element>
<xsl:element name="date">
<xsl:value-of select="../date" />
</xsl:element>
<xsl:element name="timestamp">
<xsl:value-of select="../timestamp" />
</xsl:element>
<xsl:element name="base">
<xsl:value-of select="../base" />
</xsl:element>
</mixRates>
</xsl:template>
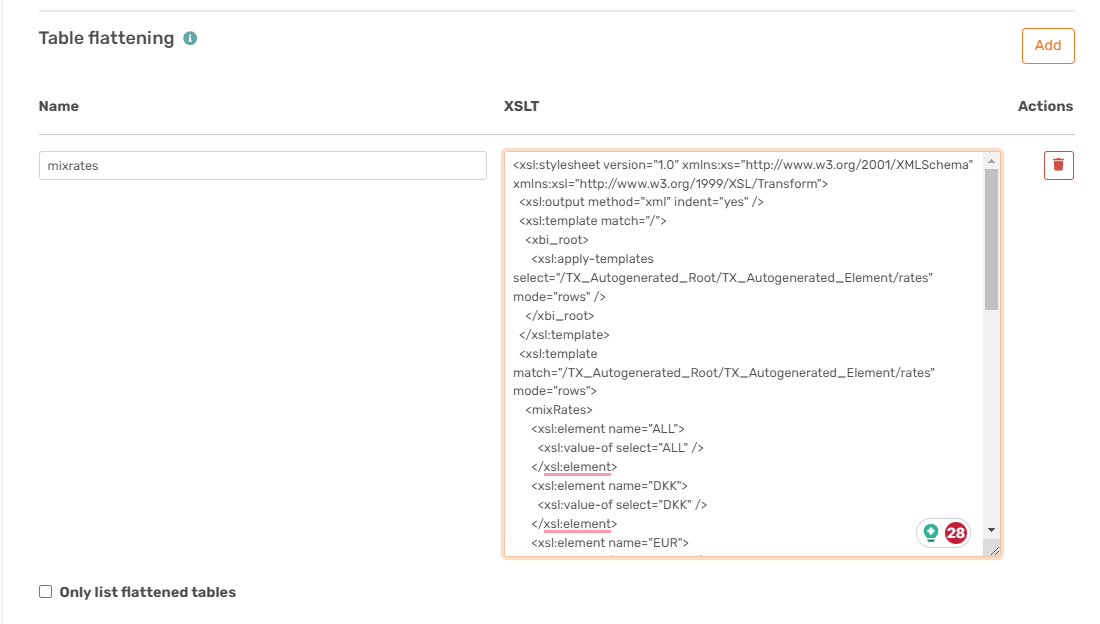
</xsl:stylesheet>The only thing you need to look for is that the xsl:apply-templates tag points at the XPath to where the rates start and the same is the match attribute for the second xsl:template tag. I chose to call the table mixRates so I did not have to check the only list flattened tables option, but you can call it Rates to keep it having the same name.
I removed the majority of available symbols (currency types), so I only got those I wanted.
At the bottom, I have added the values missing from the rates table. To connect I use ../ in front of the name. It means select the parent of the current node.
Applying the above XLS code in the XLST field like so will make this mixRates table appear.
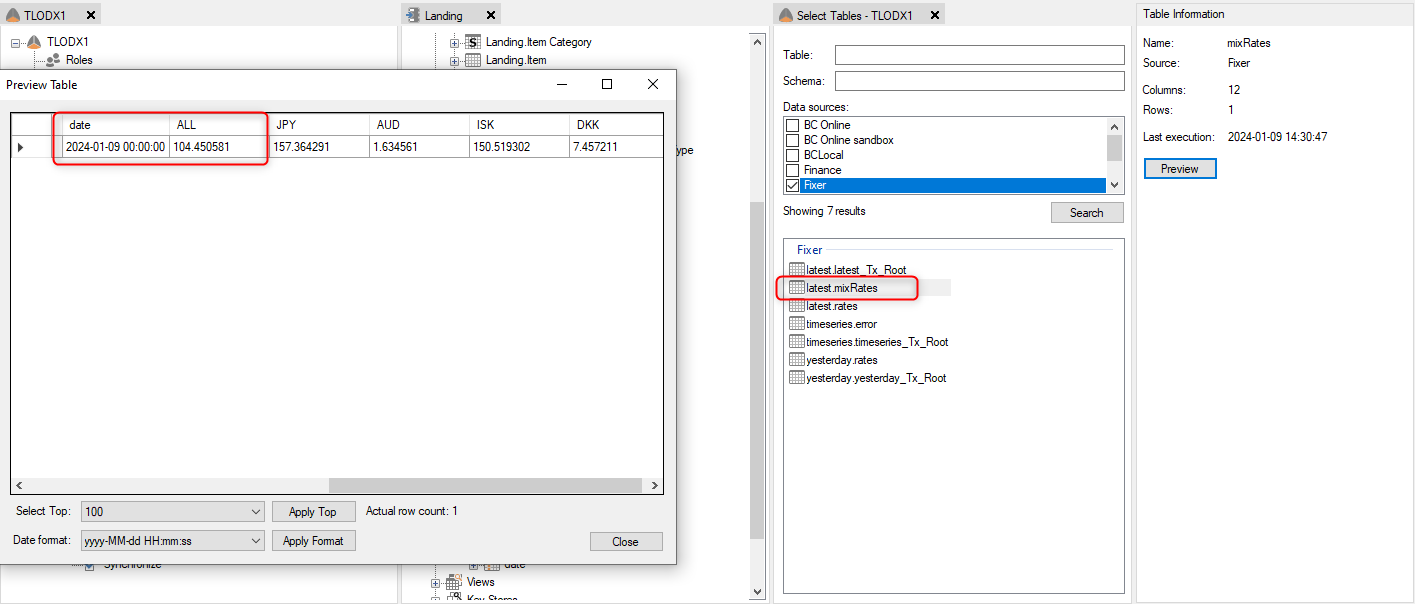
You can see how it looks here.
Use Unpivot on your XLST
As you can see the result comes in one line. Ideally the structure would be like so.
| Currency code | Currency rate | TimeStamp | Date | Base Currency |
|---|---|---|---|---|
| GBP | 861219 | 1751956814 | 2025-07-08 | EUR |
| EUR | 1 | 1751956814 | 2025-07-08 | EUR |
There is an option to unpivot the XLST so you can change the direction, similar to how you would do it in a SQL query.
You can use a function called for-each to handle this.
Here is the XLST that makes all the currency names and the rates become a column.
<?xml version="1.0" encoding="UTF-8" ?>
<xsl:stylesheet version="1.0" xmlns:xs="http://www.w3.org/2001/XMLSchema" xmlns:xsl="http://www.w3.org/1999/XSL/Transform">
	<xsl:output method="xml" indent="yes"/>
	<xsl:template match="/">
		<xbi_root>
			<xsl:apply-templates select="//rates" mode="rows"/>
		</xbi_root>
	</xsl:template>
	<xsl:template match="//rates" mode="rows">
		<xsl:variable name="timestamp" select="//timestamp"/>
		<xsl:variable name="date" select="//date"/>
		<xsl:variable name="base" select="//base"/>
		<xsl:for-each select="*[not(contains(., 'E'))]">
			<xsl:element name="Latest">
				<xsl:element name="code">
					<xsl:value-of select="local-name()"/>
				</xsl:element>
				<xsl:element name="rate">
					<xsl:value-of select="."/>
				</xsl:element>
				<xsl:element name="timestamp">
					<xsl:value-of select="$timestamp"/>
				</xsl:element>
				<xsl:element name="date">
					<xsl:value-of select="$date"/>
				</xsl:element>
				<xsl:element name="base">
					<xsl:value-of select="$base"/>
				</xsl:element>
			</xsl:element>
		</xsl:for-each>
	</xsl:template>
</xsl:stylesheet>
The initial setup of this is exactly the same as the initial suggestion all the changes are in the xsl:template tag.
First the three fields that are on a higher level are set as xsl:variable fields. So that is timestamp, date and base.
Below that I have the for-each function. It contains a select query that looks like this *[not(contains(., 'E'))]. The XPath expression selects all child elements (*) of the current context node, but only those for which the text content (.) does not contain the character 'E'.
In this the current context node is the rates, not the currency code. Some of the rates will contain invalid characters and using this will exclude them.
In the for-each the initial xsl:element is what the name of the table will become. All the xls:element tags below this will become the fields of the table.
The element tag for code has a select=”local-name()” function. This is what sets the currency code for the currency rate.
Below that is the rate field. The select=”.” locates the current value of the rate. This is the main level set in the template match, so the dot is the current rate.
Below that is the three variables that was set above. The $name is how you connect to the variable.
Change the content of the rates to show decimal points
Using this setup worked, but there was an issue. Due to cultural settings all dots in a value is read as a thousands separator and therefore ignored. What is used in our culture is that comma is the decimal sign not a dot.
Normally I would use the Table Builder and add a replace option on the field. This is a manual setup, the Table builder is not used at all and the method used in that doesn’t work in this context.
What it would suggest is this.
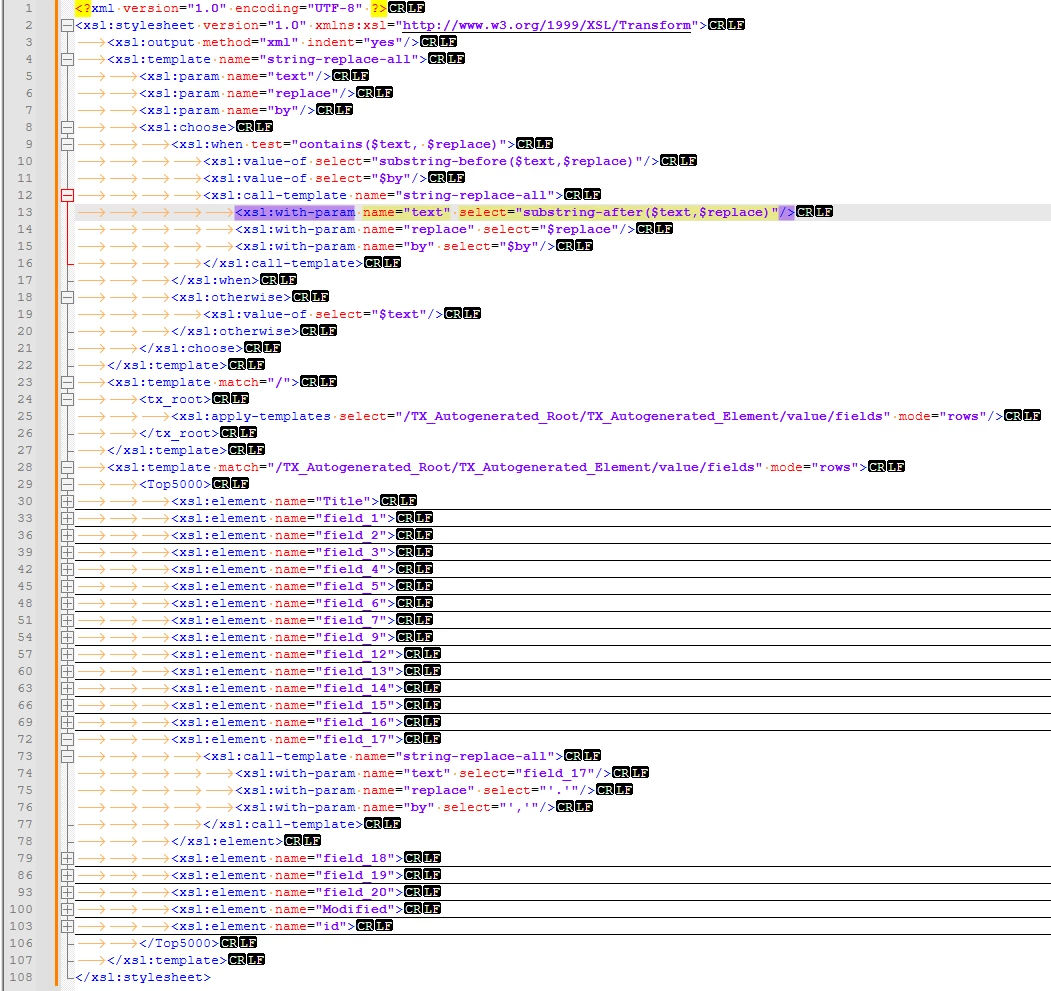
What can be done instead is simpler.
Replace this part in your <rate> element:
<xsl:element name="rate">
	<xsl:value-of select="."/>
</xsl:element>
with:
<xsl:element name="rate">
	<xsl:value-of select="translate(., '.', ',')"/>
</xsl:element>
So using the translate() function can help with doing that. translate(., '.', ',') will take the string value of the current node (.), and replace every dot (.) with a comma (,).
So using that and merging the endpoints together in one table gives this result.
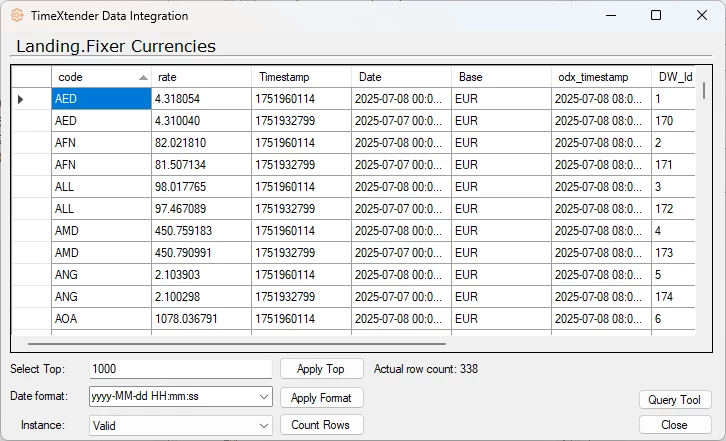
Odd how despite us changing the dots to commas it still is shown with a dot as the decimal point. That is the culture settings for you.
