


Introduction to Aggregate Tables
Aggregate tables in TimeXtender allow users to combine data efficiently to calculate averages, sums, counts, and minimum or maximum values. These tables are particularly useful for standardized or ad-hoc reports that do not require frequent changes. They are quick to set up, reliable, and easy to use for both developers and end-users.
However, Aggregate Tables are less flexible compared to OLAP cubes. They do not support pivoting or drilling down into detailed transactional data. This makes them less suitable for analysts who need to explore data in various ways. Despite these limitations, aggregate tables are a powerful tool when used in the appropriate context.
This guide demonstrates how to create an aggregate table using the AdventureWorks 2012 database as an example.
This guide uses the demonstration database AdventureWorks 2012 as a data source, which can be downloaded here. Two sample projects are attached to this article as well. Aggregate Demo (Start) contains the staging area shown above. Aggregate Demo (Complete) contains the advanced aggregate table shown at the end of this guide.
Creating an Aggregate Table
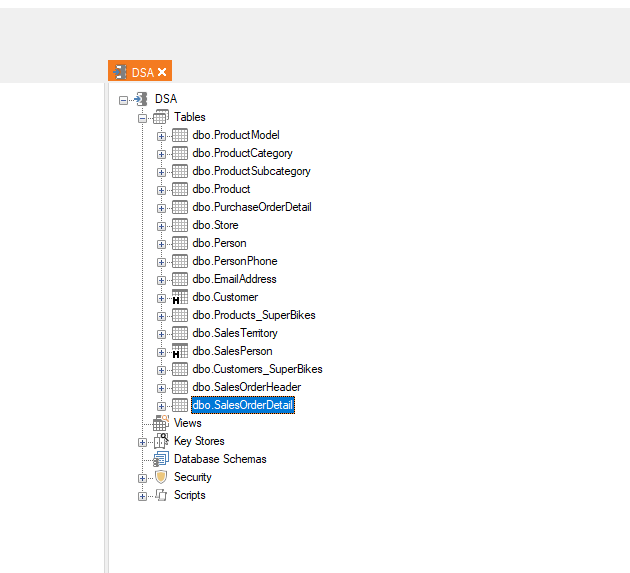
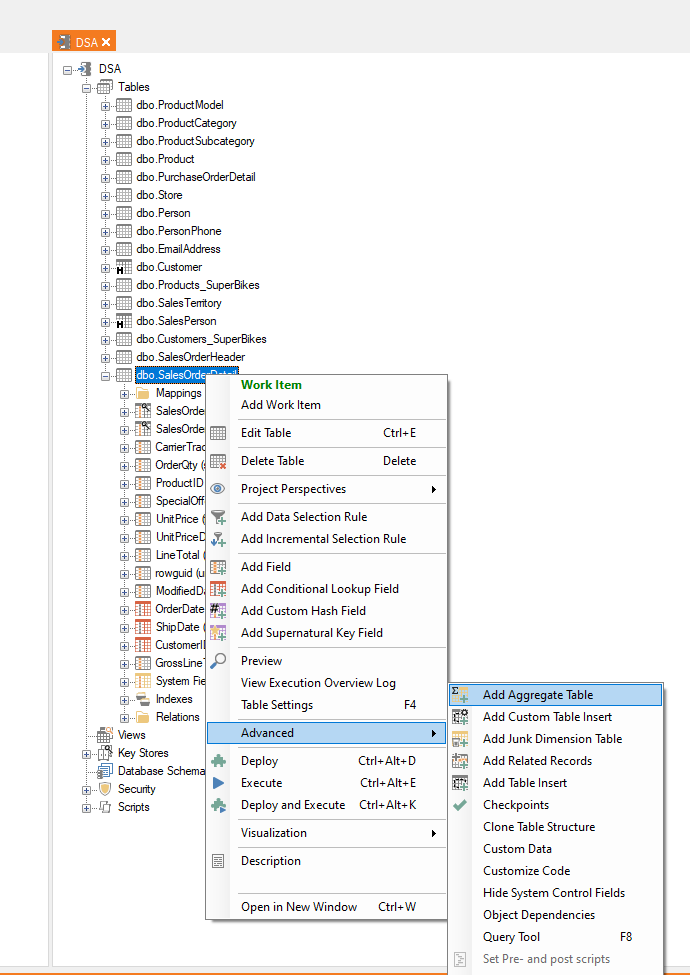
Aggregate tables are based on the data of a pre-existing table. In this case, the goal is to aggregate sales data, so the our Aggregate table will be based on the SalesOrderDetail table. Right-click on the table and navigate to Add Aggregate Table as shown below.
Configuring an Aggregate Table
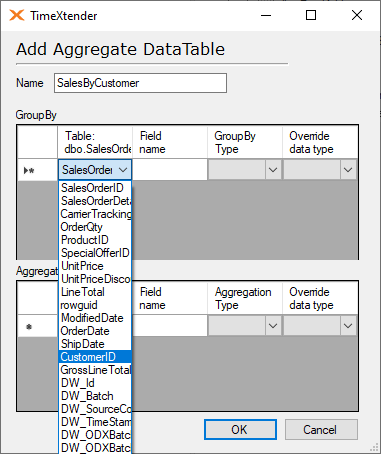
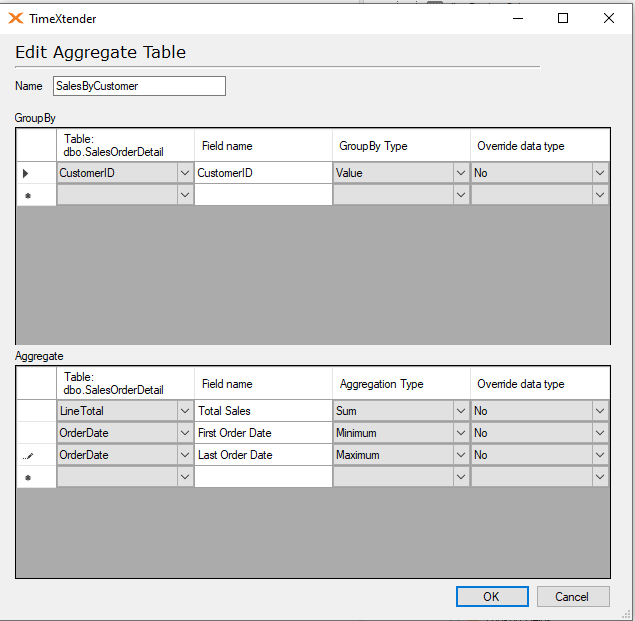
There are two main sections to configure in an aggregate table. In the Group By section above, specify the fields that will be used to analyze the data with. In the Aggregate section below, select which fields to be aggregated as well as the aggregatation type, i.e count, sum, average, etc. In this example, we want to get a sum total of sales by customer.
- Start by entering an appropriate name for your Aggregate table.
- Under GroupBy, select CustomerID as the unique identifier for each customer.
-
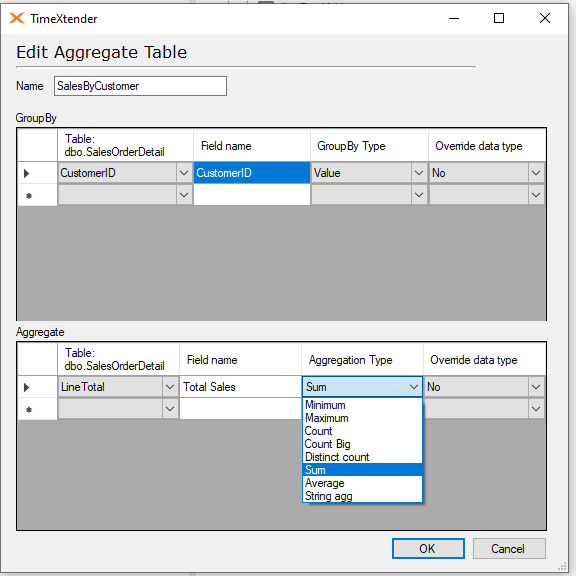
- Under Aggregate, choose LineTotal, which is the net sales amount for each sales transaction.
- In the Field Name column, rename the LineTotal field name to “Total Sales” in order to make it clear that this is an aggregation.
- Set the Aggregation Type to Sum.
Click OK when you are done. The aggregate table will appear at the bottom of the table list as a yellow table with a black sigma character: ![]() .
.
Add Lookups (Optional)
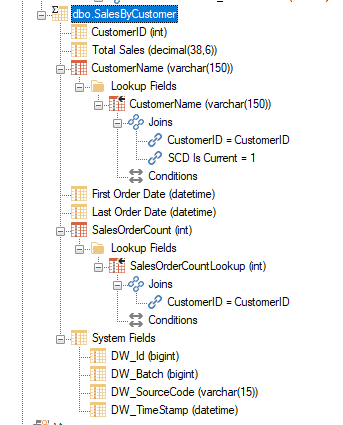
If the aggregate table feeds a highly standardized report that requires no more advanced analysis, it can sometimes be a good idea to add additional information to the aggregate table that you'd ordinarily want to retain in a dimension table. If your analysts only ever want to see customer name and number, and no other customer-related data, it can save time and effort to bring customer name in as a lookup field. Since your Aggregate Table is grouping on the CustomerID field, you may be able to click and drag the CustomerName field from the Customer table onto the SalesByCustomer Aggregate table, and then choose the options to create the Join. You can also right-click on the Aggregate Table and select Add Conditional Lookup Field to add in the CustomerName field from the Customer table. Once complete, your SalesBy Customer Aggregate table may appear similar to the following:
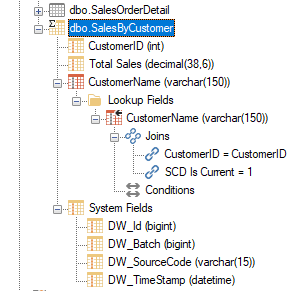
The Conditional Lookup field above is getting its value from a History enabled table so the Join includes the “SCD is Current = 1” condition.
End Result
After deploying and executing the staging area, you should be able to preview your aggregate table and see the data as shown below.
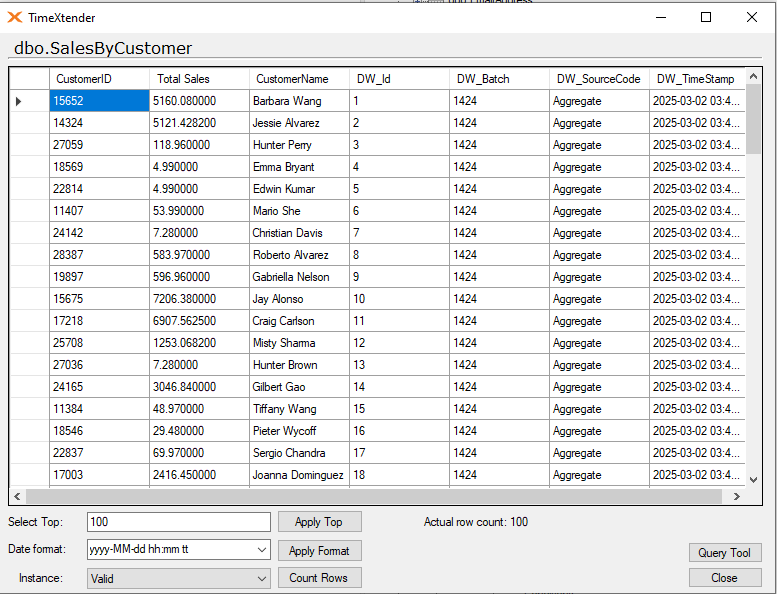
This format makes asking certain questions very easy. For instance, if you wanted to see the top ten all-time customers, you could simply use a query like this:
SELECT TOP 10 CustomerName, TotalSales
FROM CustomerSales_V
ORDER BY TotalSales DESC
Advanced Aggregate Tables
Other common fields your analysts might be interested in are the customer's first order date, most recent order date, and the number of lifetime orders they've placed.
FirstOrder and LastOrder are simply aggregate fields based on OrderDate from SalesOrderDetail that use the minimum and maximum aggregation functions.
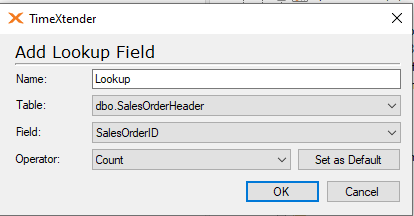
When building this type of table, it's helpful to remember that lookups are actually aggregations as well! We can add the Sales Order Count as a Conditional Lookup from the Sales Order Header table and return the Count of SalesOrderIDs.
Once deployed, the Aggregate table will appear as follows:
After execution, the data in the advanced aggregate table may appear similar to the following:
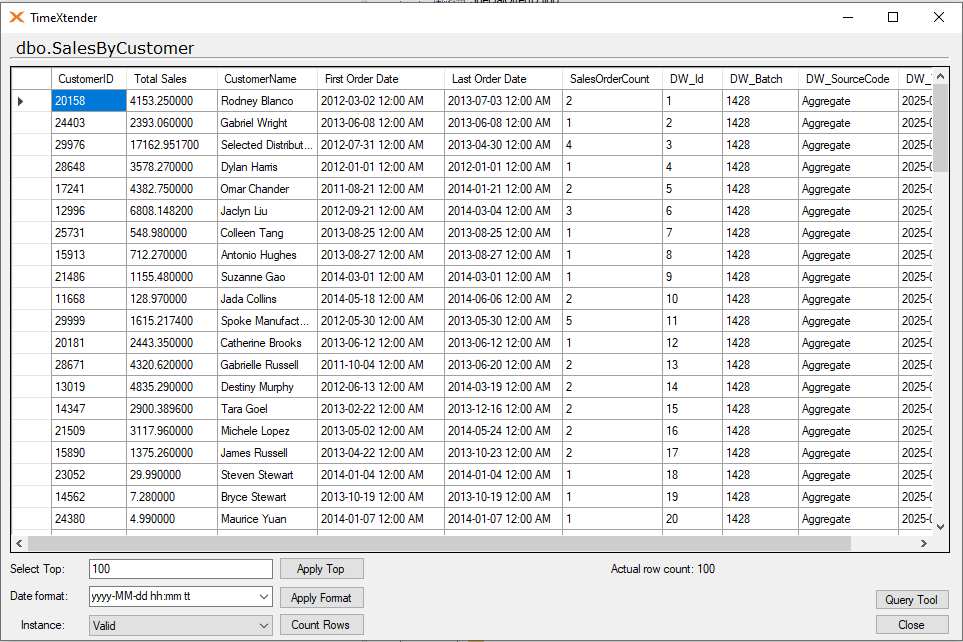
With aggregate tables and a few minutes of development time, you have now provided your analysts with some vital customer data. For more advanced reporting, a proper data warehouse, cube, or front-end reporting system will be required, but for highly formatted or ad-hoc reporting, aggregate tables can be a powerful tool.
