
As projects grow, the increasing complexity can make it hard to keep track of all objects and their dependencies. To help you with this, TimeXtender contains four visualization features:
- Data lineage
- Impact Analysis
- Relation Diagram
- Data Flow
The relation diagram is only available on tables, while the other types can be used on most objects in TimeXtender.
The purpose of data lineage is to show how objects gets their data, while the impact analysis feature clarifies how data is used. The relation diagram displays the relations that have been established to and from the table in question.
Data Lineage
- Right click on an object, click Visualizations and the select the desired type of visualization.
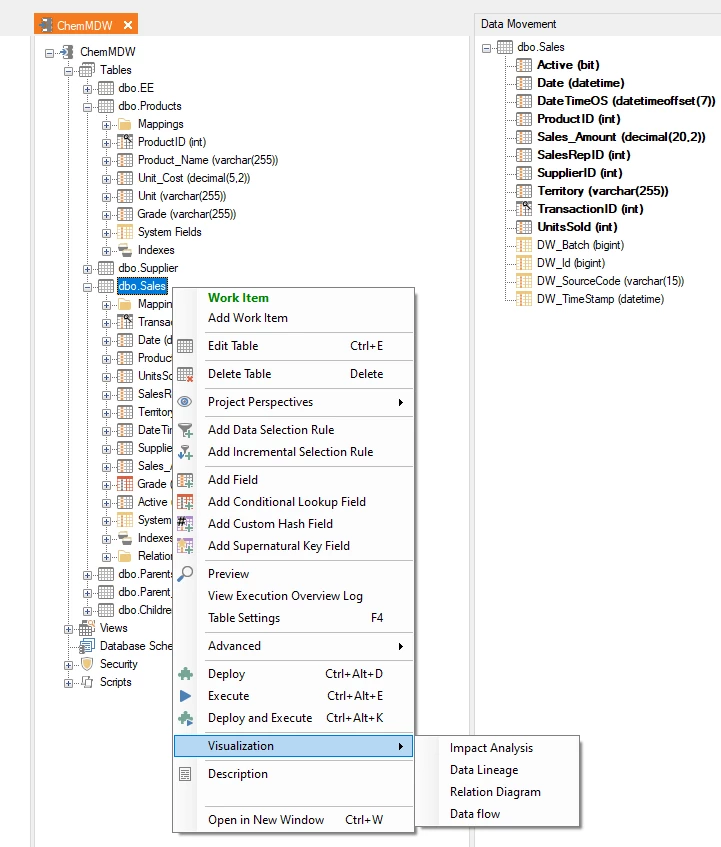
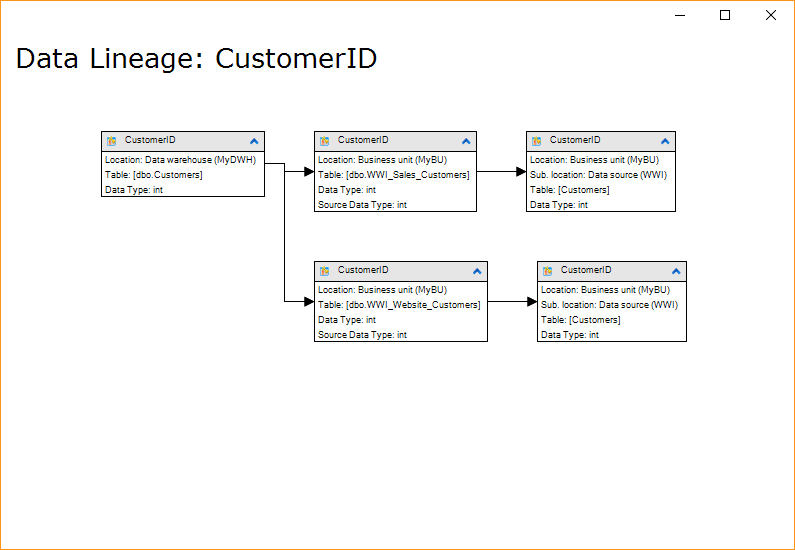
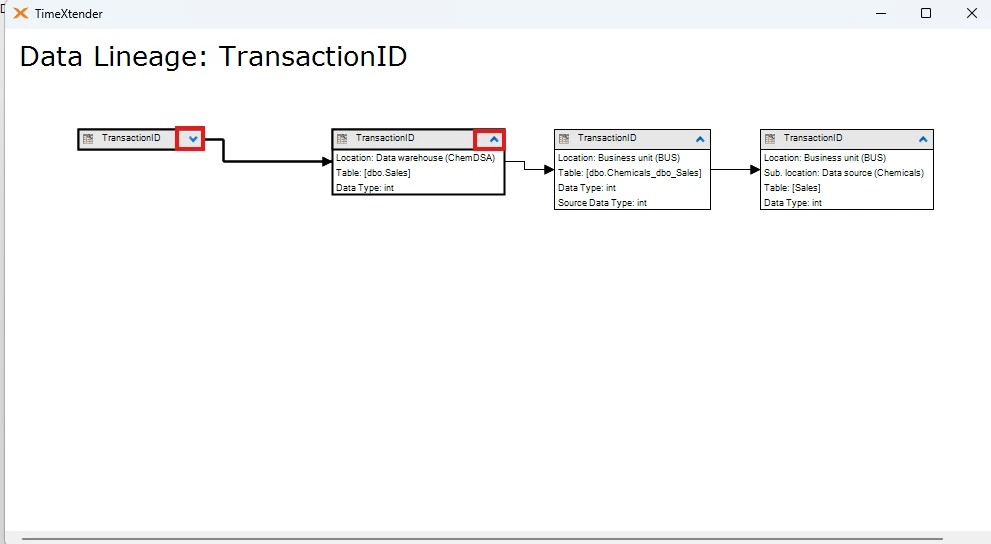
Selecting Data Lineage from the Visualization menu will provide a diagram similar to the following that traces the objects and their mapping from the beginning to the end of the project.
Customizing the Display
The visualization window has different options available that can be used to customize the display:
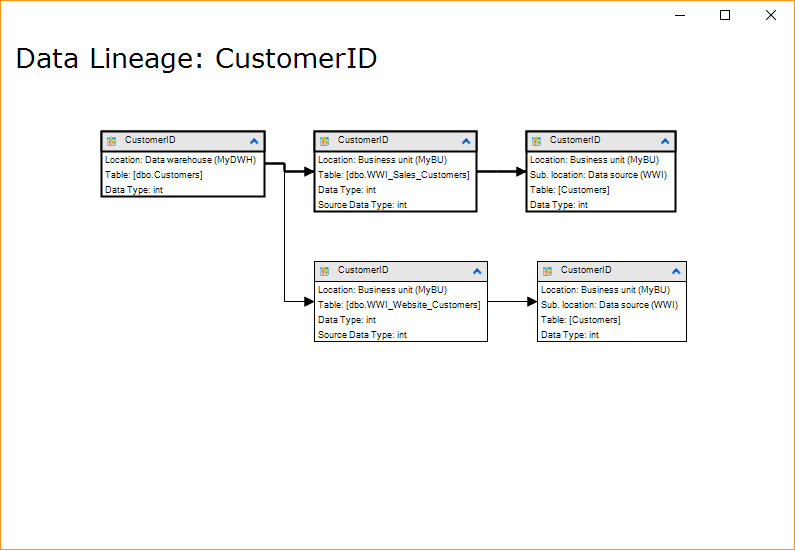
- Click an object to have the connections to and from the object highlighted in bold.
- Click and hold on an object to move it around and then release the mouse button to place it in the new location.
- Click the arrow in the header of an object to hide or show the object details.
- Right-click the background in the window to bring up a menu with different options for organizing and displaying the data:
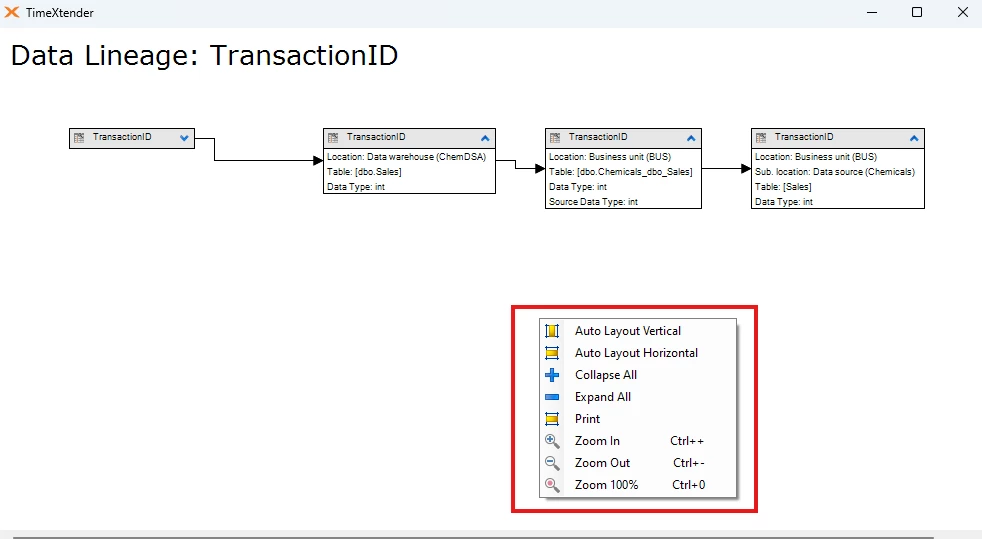
- Click Auto Layout Vertical or Auto Layout Horizontal to make TimeXtender reorder the objects.
- Click Collapse All or Expand All to either collapse the objects to create a better overview, or expand the objects to see more details.
- Click Print to bring up a Print window, where you can select print options and print the diagram.
- Click Zoom In, Zoom Out or Zoom 100% change the size of objects.
Impact Analysis
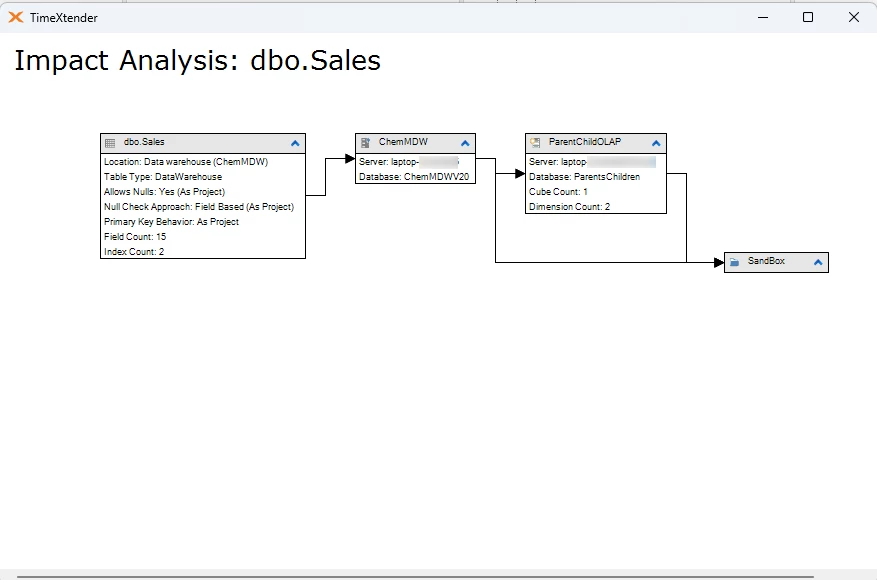
Clicking on Impact Analysis the Visualization menu will provide more detail on the related objects in the project showing how they are used. The information displayed will depend on the type of object and the following are examples of some of the following information that may be included.
- Server Instance
- Database Name
- Allow Nulls
- Primary Key Behavior
- Field Count
- Index Count
- Dimension Count
- Cube Count
Relation Diagram
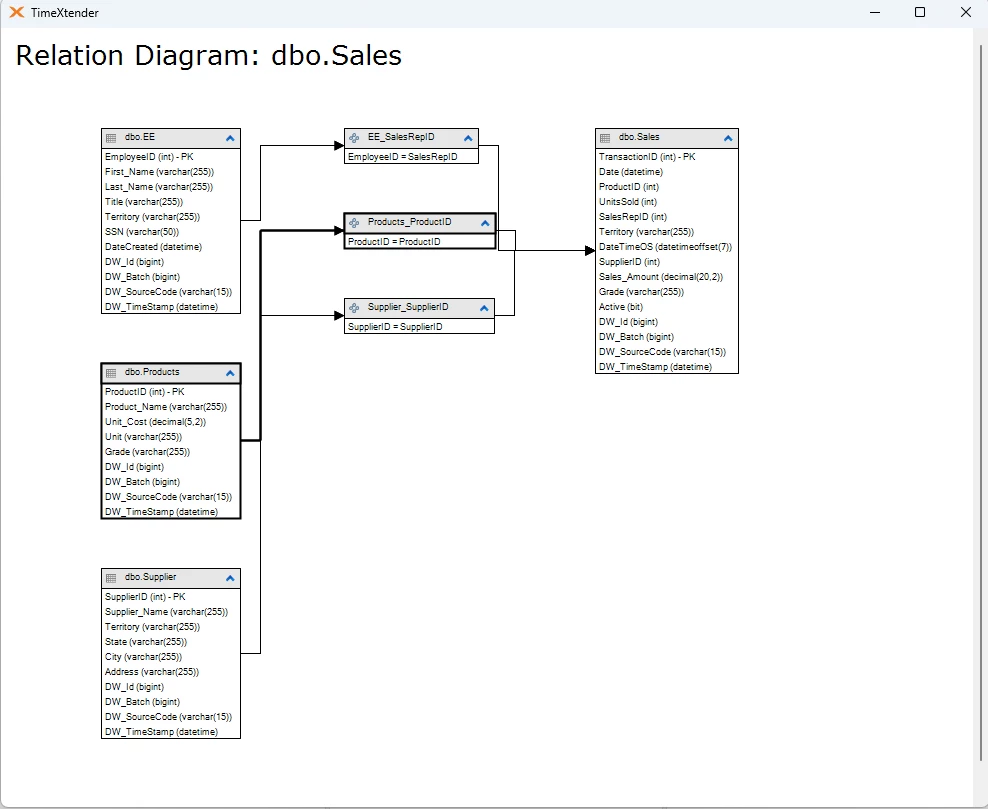
Selecting the Relation Diagram in the Visualization menu will provide a diagram with all of the relations that have been established to and from that particular table. Clicking on a particular table in the diagram will bold the path of that object to help visualize the flow of that particular relation.
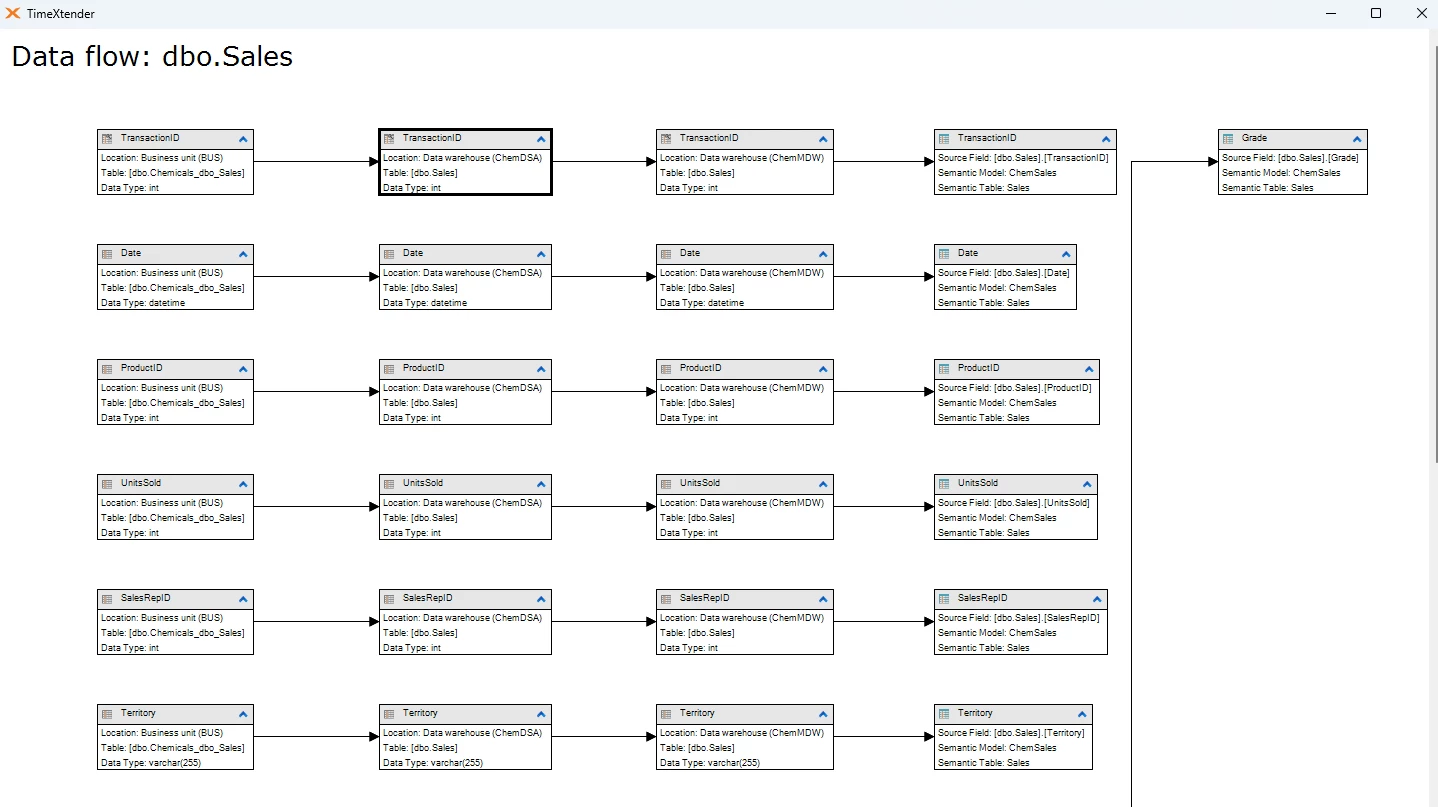
Data Flow
The last item in the Visualization menu is Data Flow. Selecting this for a particular table will show how all of the fields in the table are populated from the beginning to the end of the project.