
I have a need to calculate a measure which would reflect the revenue growth over the year on different categories in percentage.
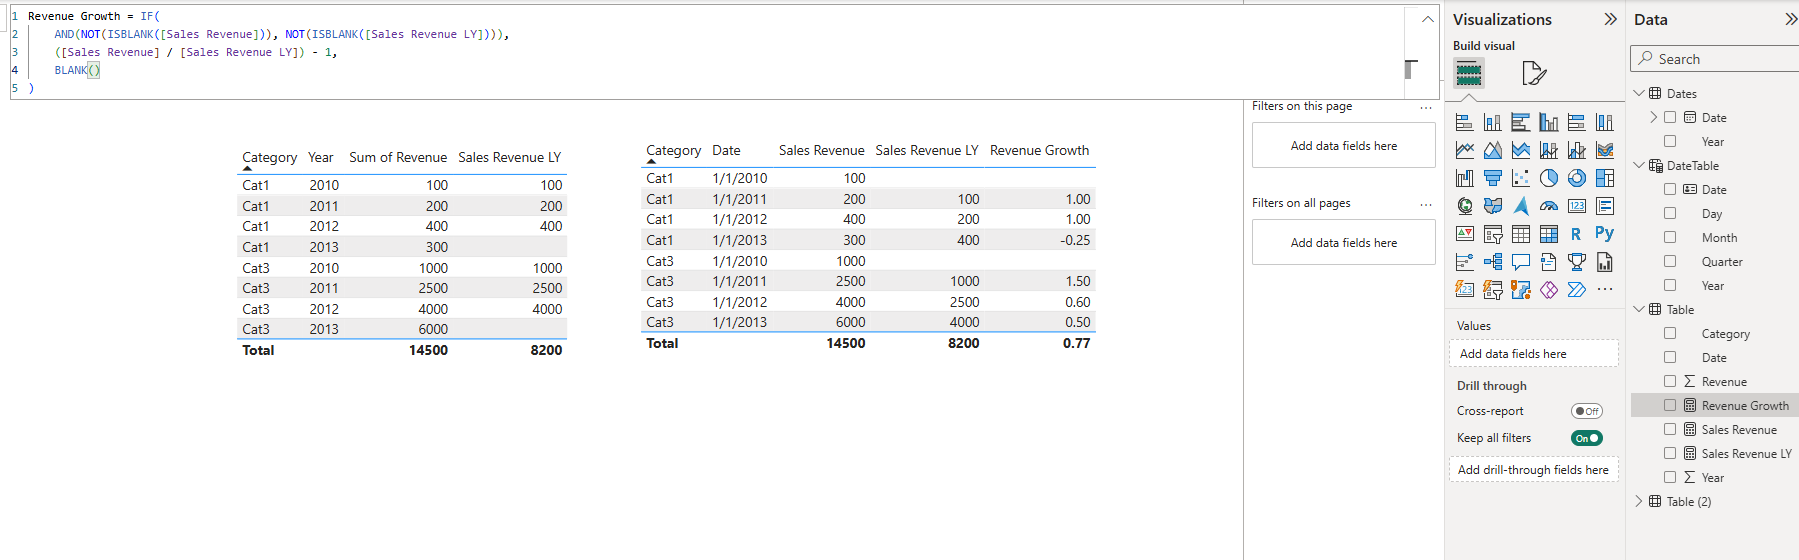
Currently i have a custom measure in semantic layer with following formula: Revenue Growth = ([Sales Revenue] / [Sales Revenue LY]) - 1
The categories in dimension which i have are Cat1, Cat2 (no data in the fact), Cat3. However if i try to show this on excel, it includes the Cat2 which has no records in the fact table, and also gives me an “empty” category which, i assume, is “summarization” like this:
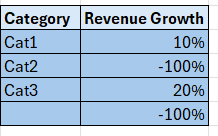
Is there any way to make sure that the empty row and the category with no data in the fact would not appear?