

When accessing the 'Process Maps' tab from the main menu, you'll find a table displaying all available process maps. Currently, these maps must be created in the O&DQ (Orchestration and Data Quality) desktop client and then deployed to 'PROD' in order to be visible in this list. However, we're actively working on enabling the creation of process maps directly in Turnkey.
Understanding Process Maps
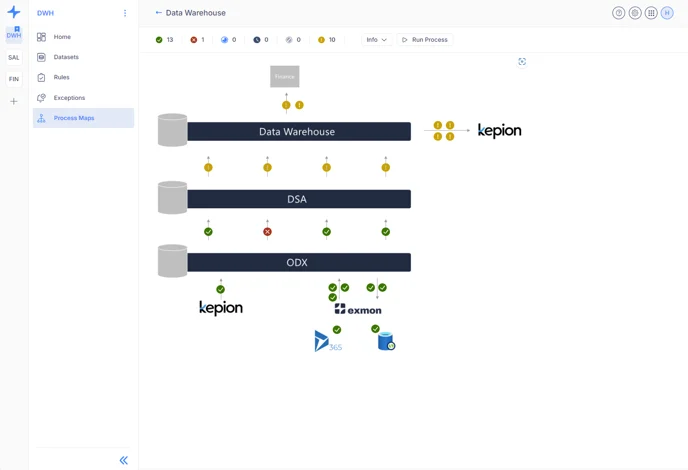
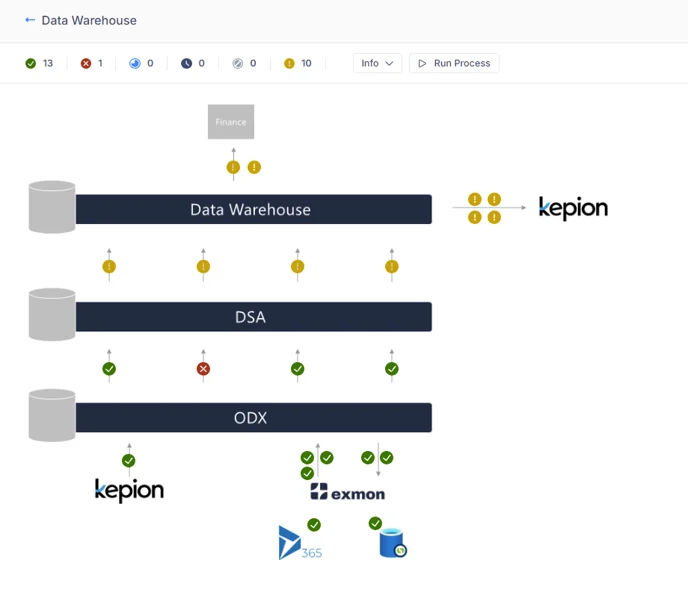
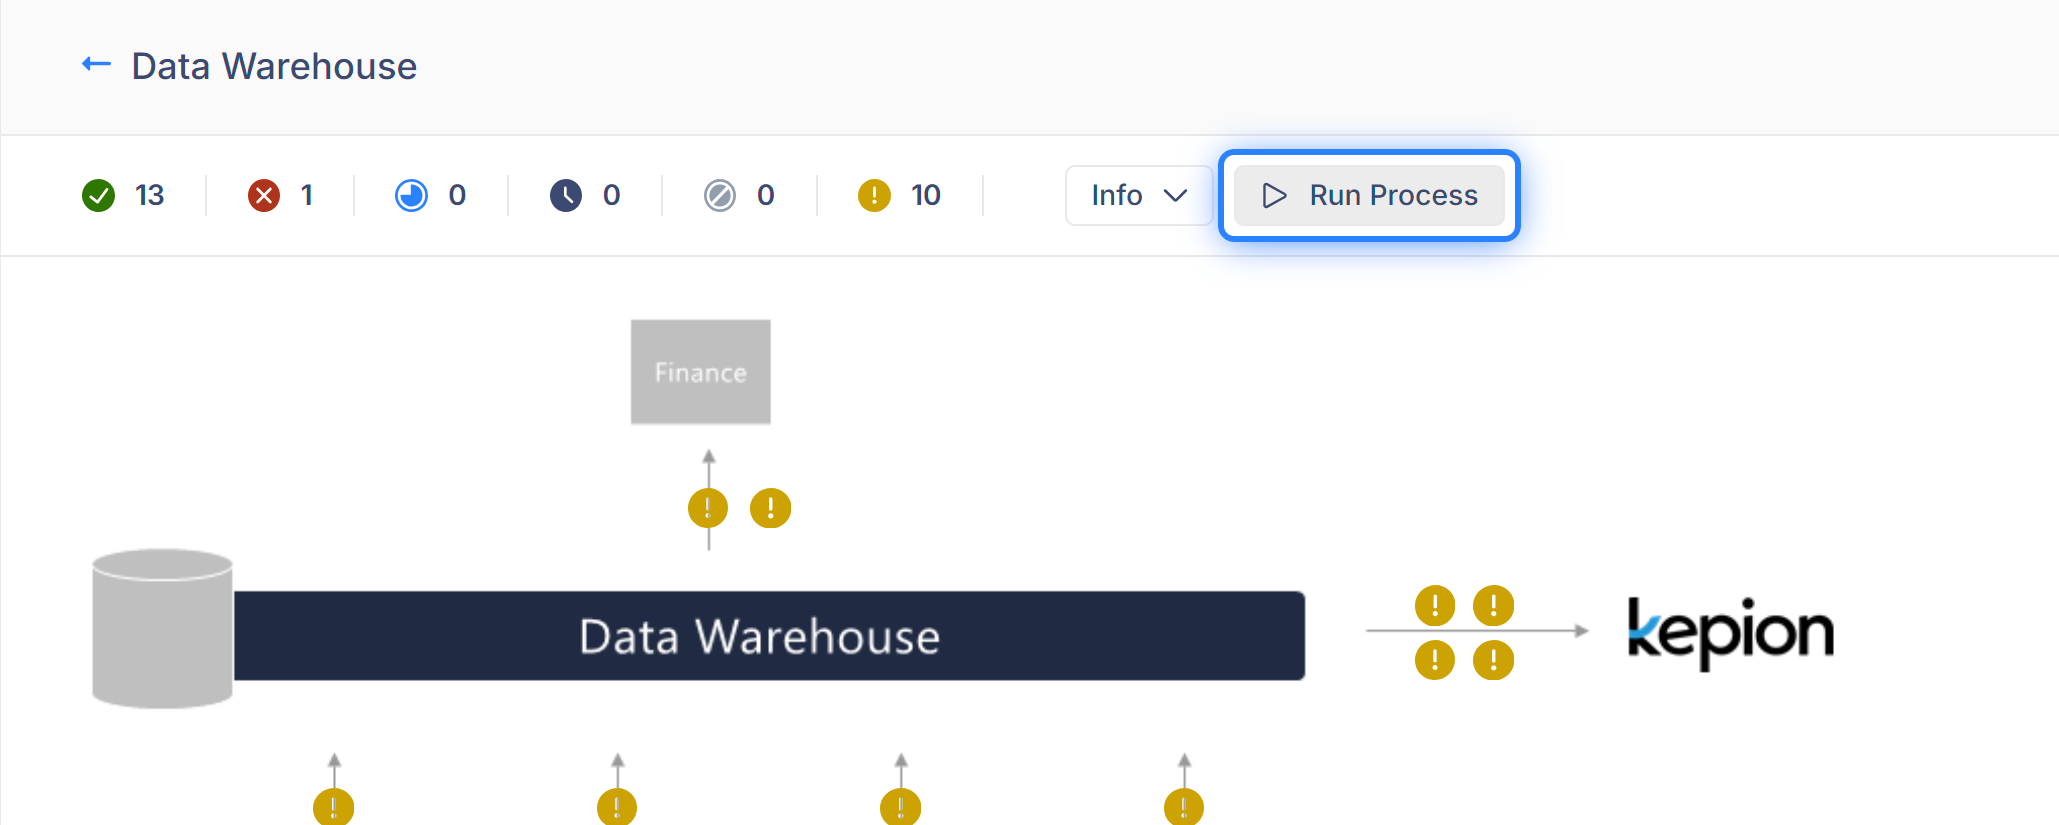
Upon selecting a process map, you're directed to a page where the map occupies the center. The page also features a header containing a status bar, an info button, and a run process button.
Status Bar
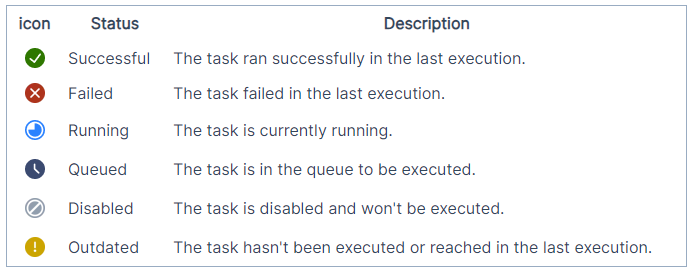
The status bar provides a quick overview of the current state of tasks within the process map.
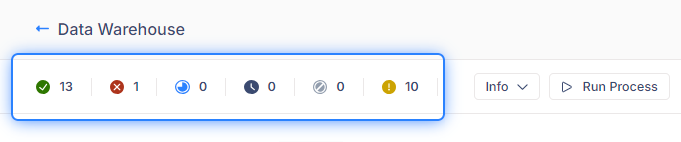
Below is a table detailing the different task icons and their respective descriptions. These icons serve as visual indicators, allowing users to quickly understand the current status of each task within the process map.
Info
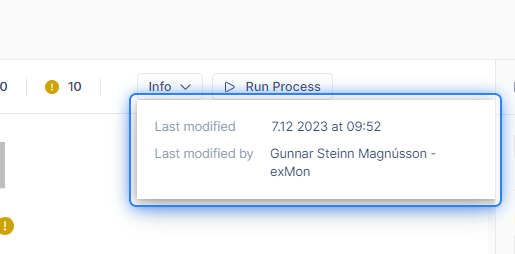
The info button in the header provides additional details about the process map such as when it was last modified and by who.
Running the Process
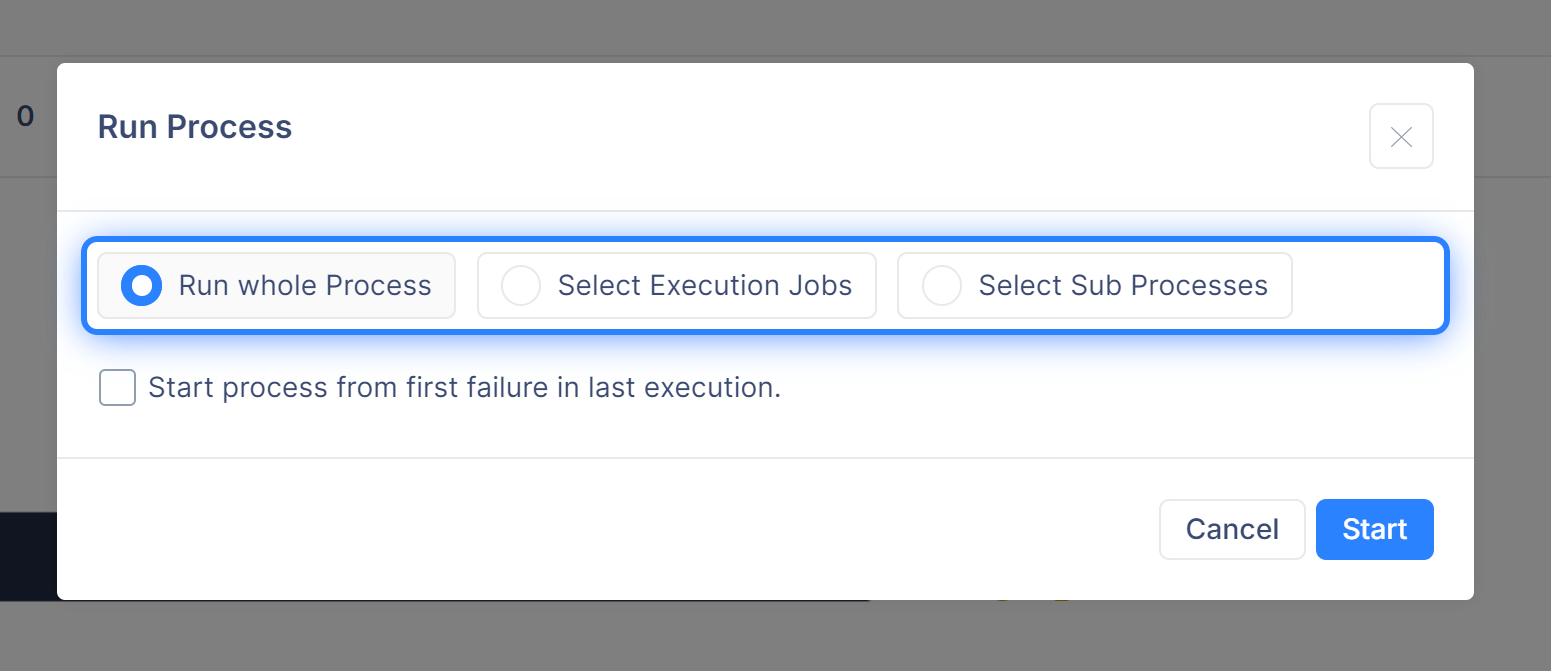
The 'run process' button allows you to initiate the process. You have several options:
- Run the Whole Process: Execute the entire process as it was created.
- Run Sub Processes: Select individual steps to run from the process.
- Execution Jobs: Execution jobs are specific sub routes within the process, designed to be run independently. Admins can set up execution jobs to mitigate data risks by ensuring only safe tasks are run individually.
Monitoring Progress
As the process runs, you'll see each task's status update in real-time, enabling you to monitor progress efficiently.
Interacting with Tasks
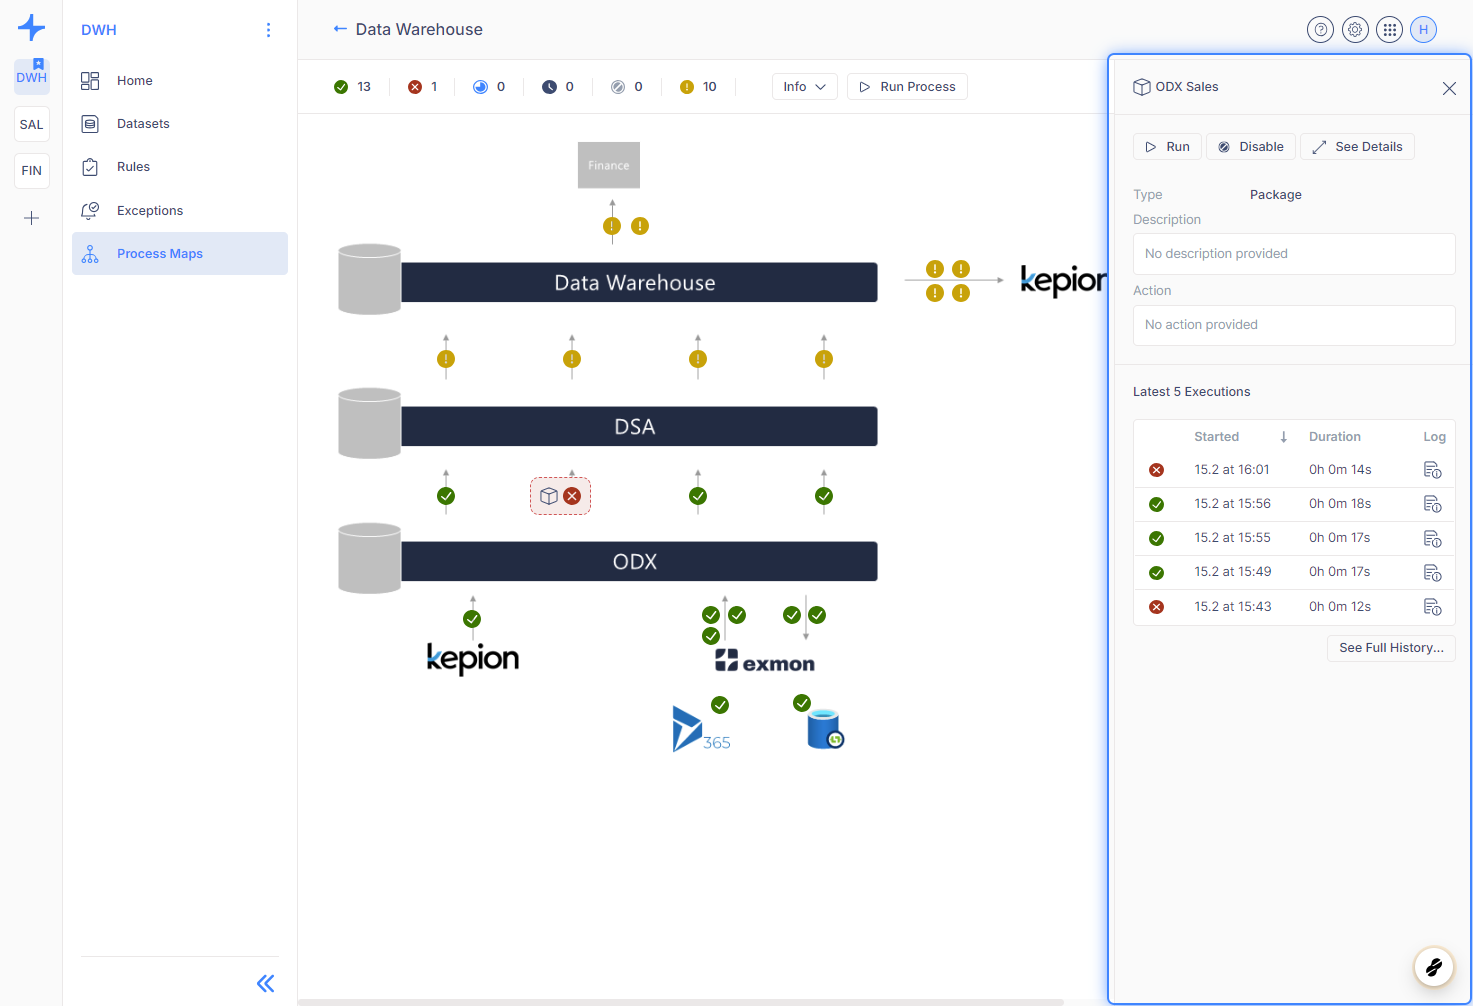
When you click on a task within the process map, a panel appears on the right side of the screen, offering several options.
Individual Task
When selecting an individual task (rule, package, query, compare query) within the process:
-
Buttons: At the top, you'll find three buttons: "Run", "Disable", and "See Details". These actions are applied to this specific task.
-
Properties: Below the buttons, there's a section displaying properties such as type, description, and action of the selected task.
-
Exceptions: If the task has the exception manager enabled, you'll see information about the number of open exceptions associated with it.
-
Execution History: Towards the bottom, there's a grid displaying the last five executions of the task, along with a button labeled "See History" if you want to see the complete history.
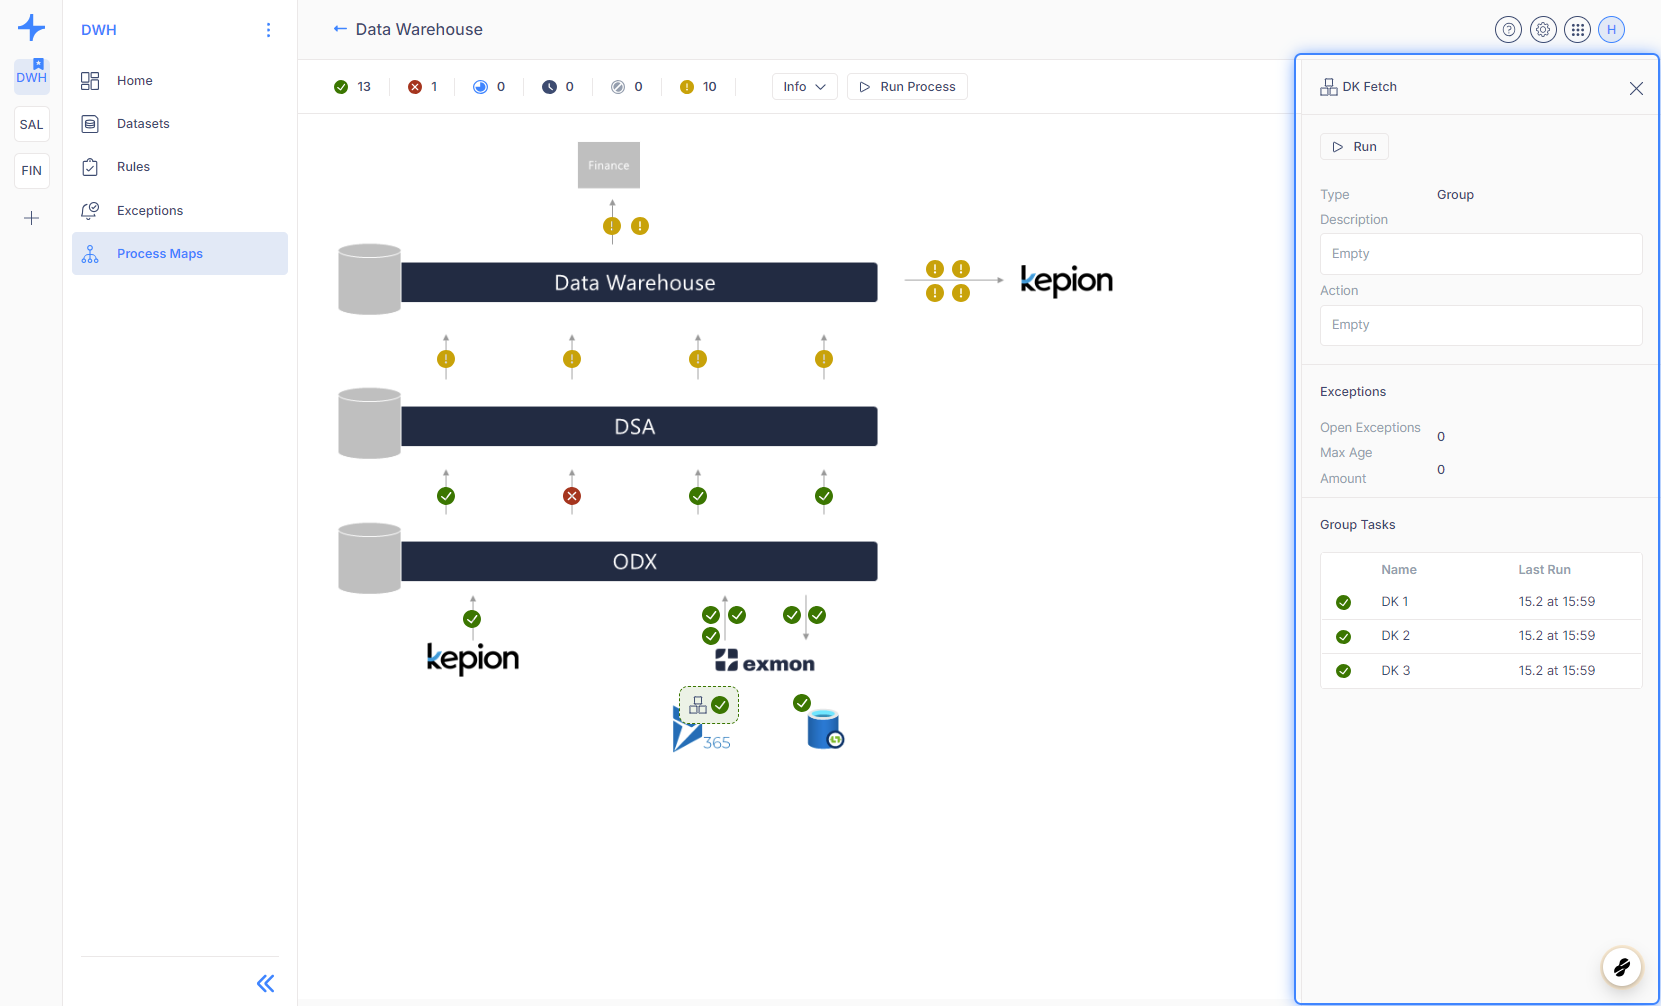
Object Group
When selecting an object group within the process map:
-
Buttons: You'll see a "Run" button, as object groups do not support individual task interaction options.
-
Properties: Similar to individual tasks, this section displays properties such as type, description, and action of the object group.
-
Exceptions: If any task within the object group has the exception manager enabled, you'll see information about the number of open exceptions.
-
Task List: Below the properties, there's a list of tasks within the object group, along with their status. You can select any task from this list to view its details.
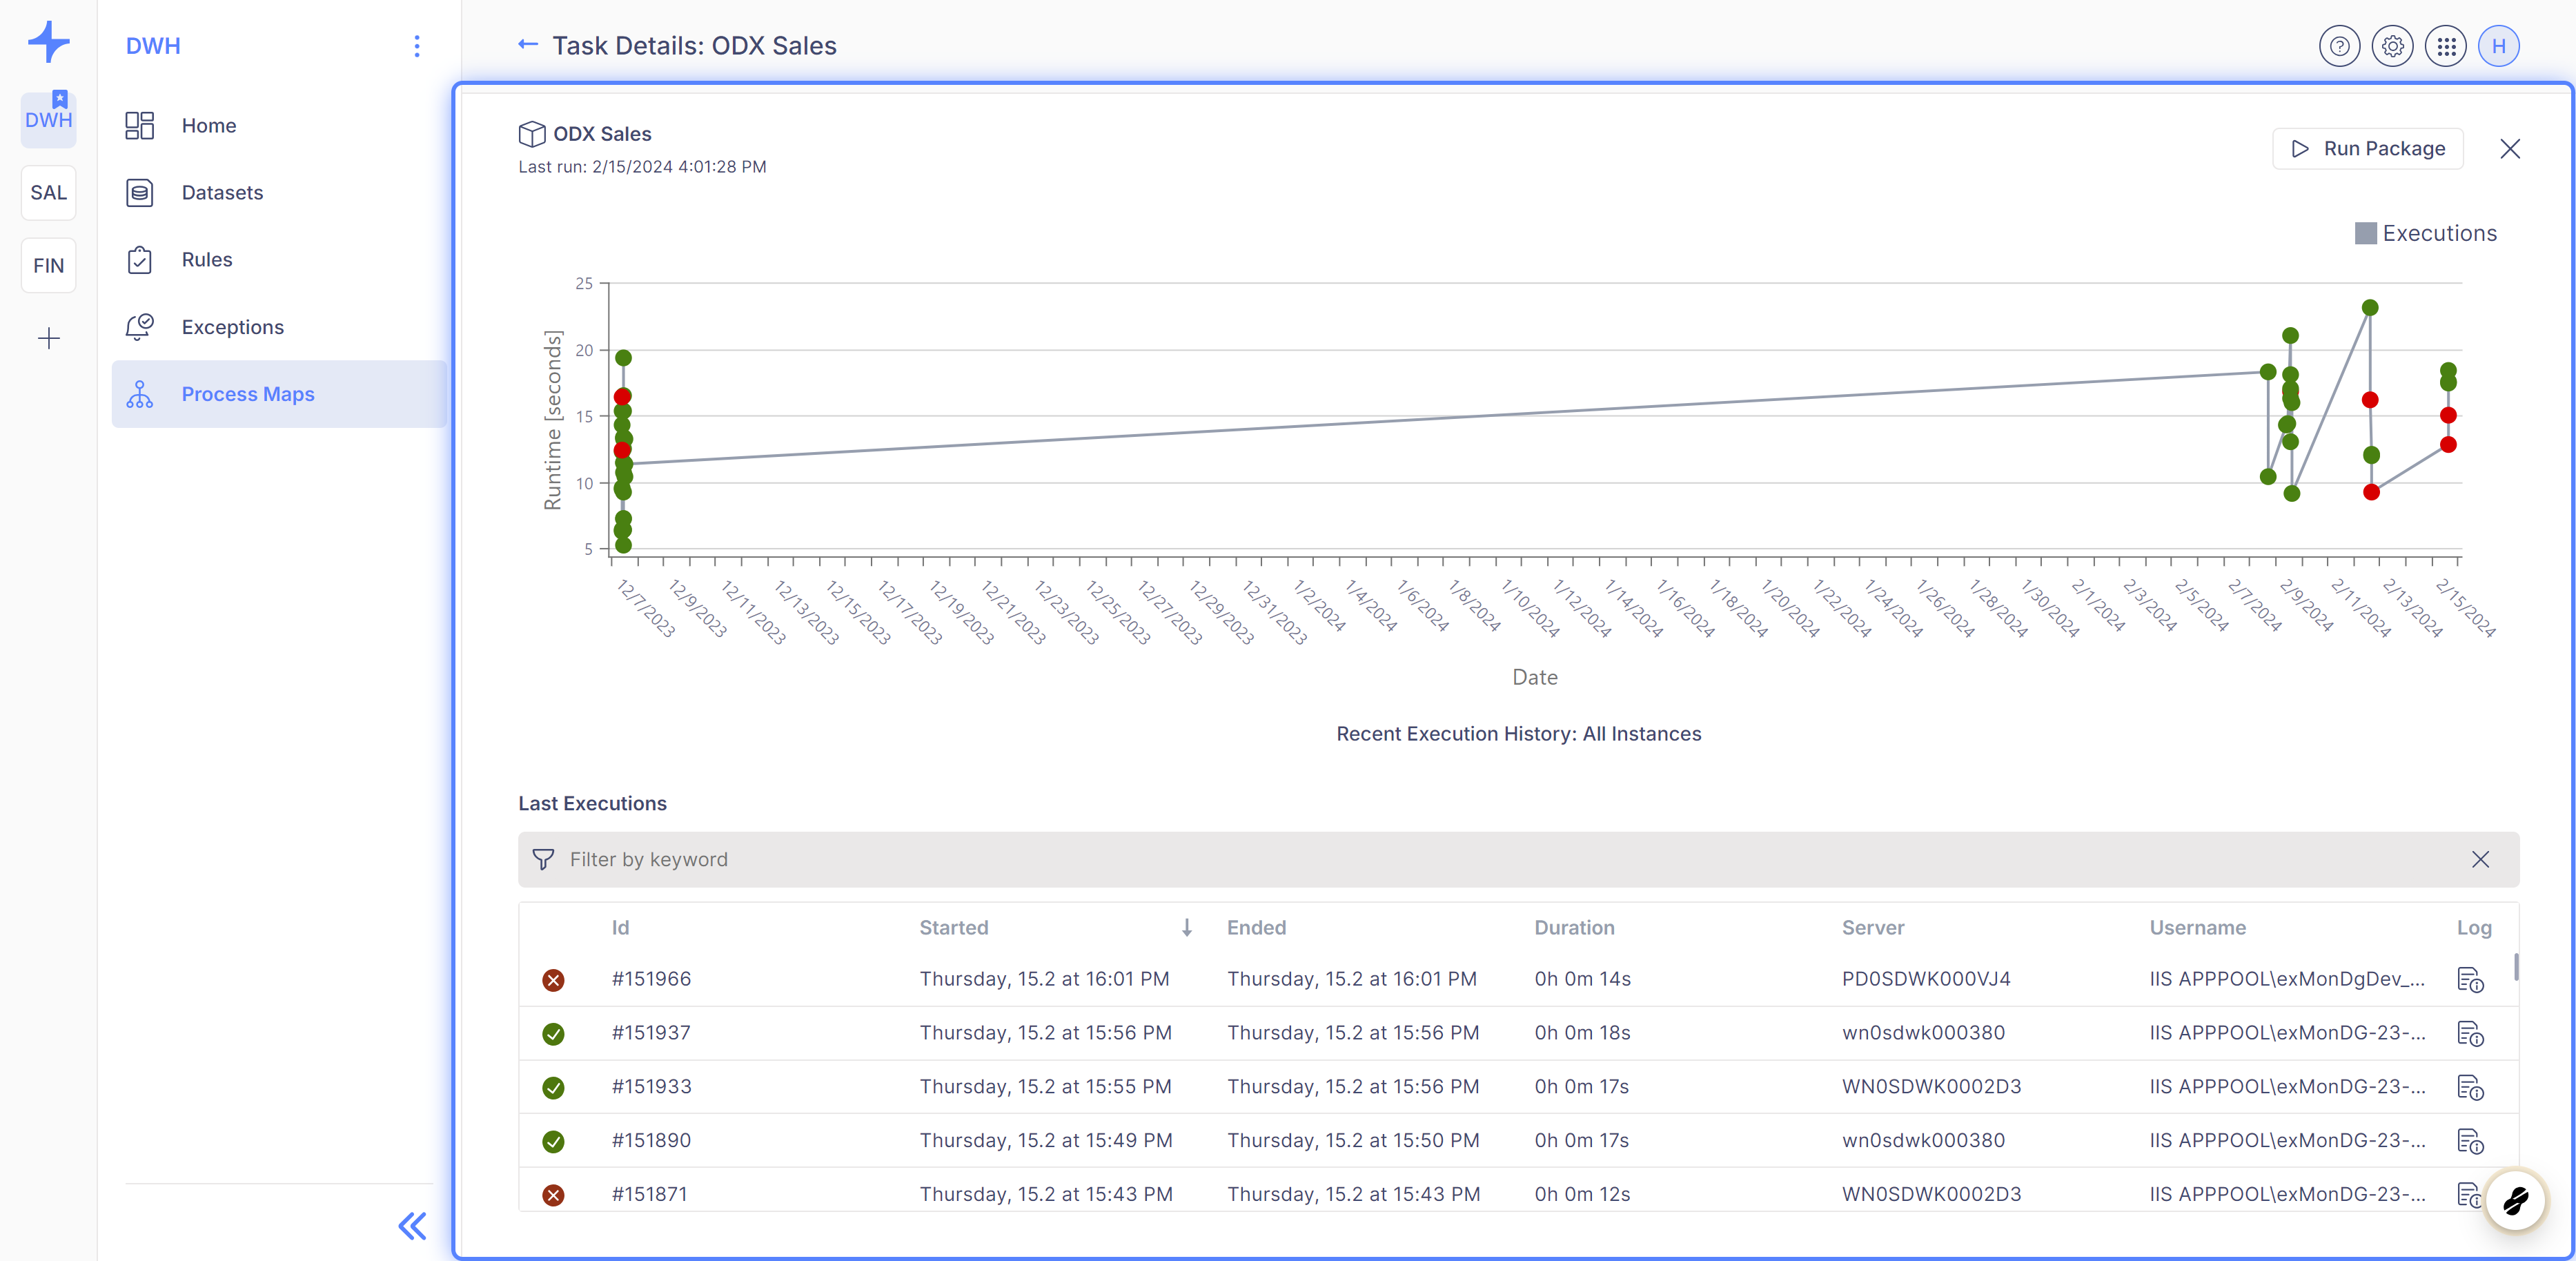
Viewing Task Details
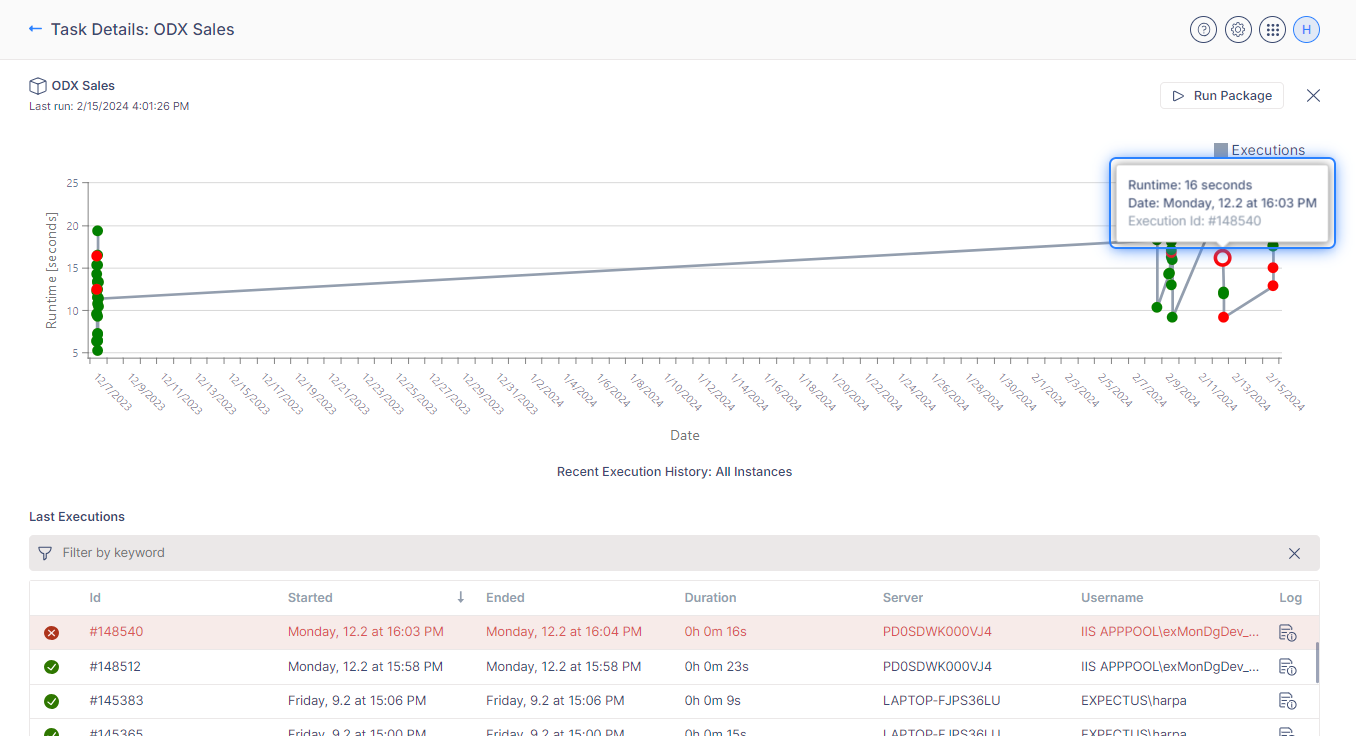
When viewing task details, whether by selecting 'See details' for an individual task or choosing a task from the group tasks table within the object group right panel, you'll be directed to the task detail page. At the top of this page, you'll find the execution history line chart for the last 50 instances. Each point represents an execution. Points are color-coded: green for success and red for failure, making it easy to spot issues.
Clicking on a point highlights the corresponding execution row in the grid below. Hovering over a point provides additional details such as execution ID and duration.
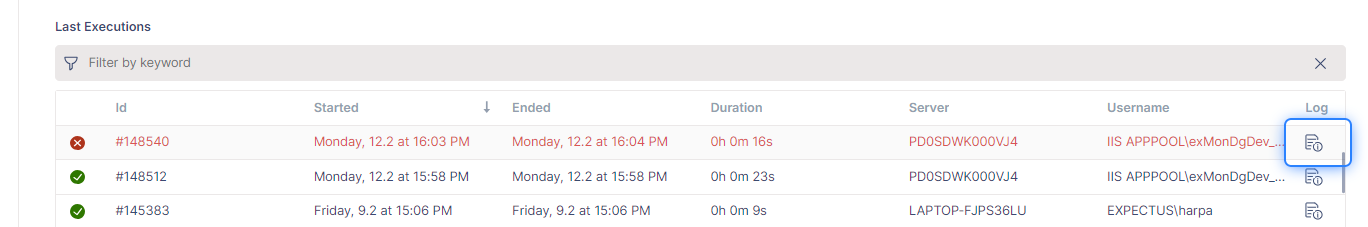
The table below the chart allows for searching specific executions, with each offering the option to view detailed logs by selecting the document icon, aiding in troubleshooting.