

Xpilot Analytics turns your data into a conversation. Ask a question in plain English — “what were our top five products last quarter?” — and Xpilot writes the query, runs it against the semantic models your data team already built in TimeXtender, and answers with the chart or table to match.
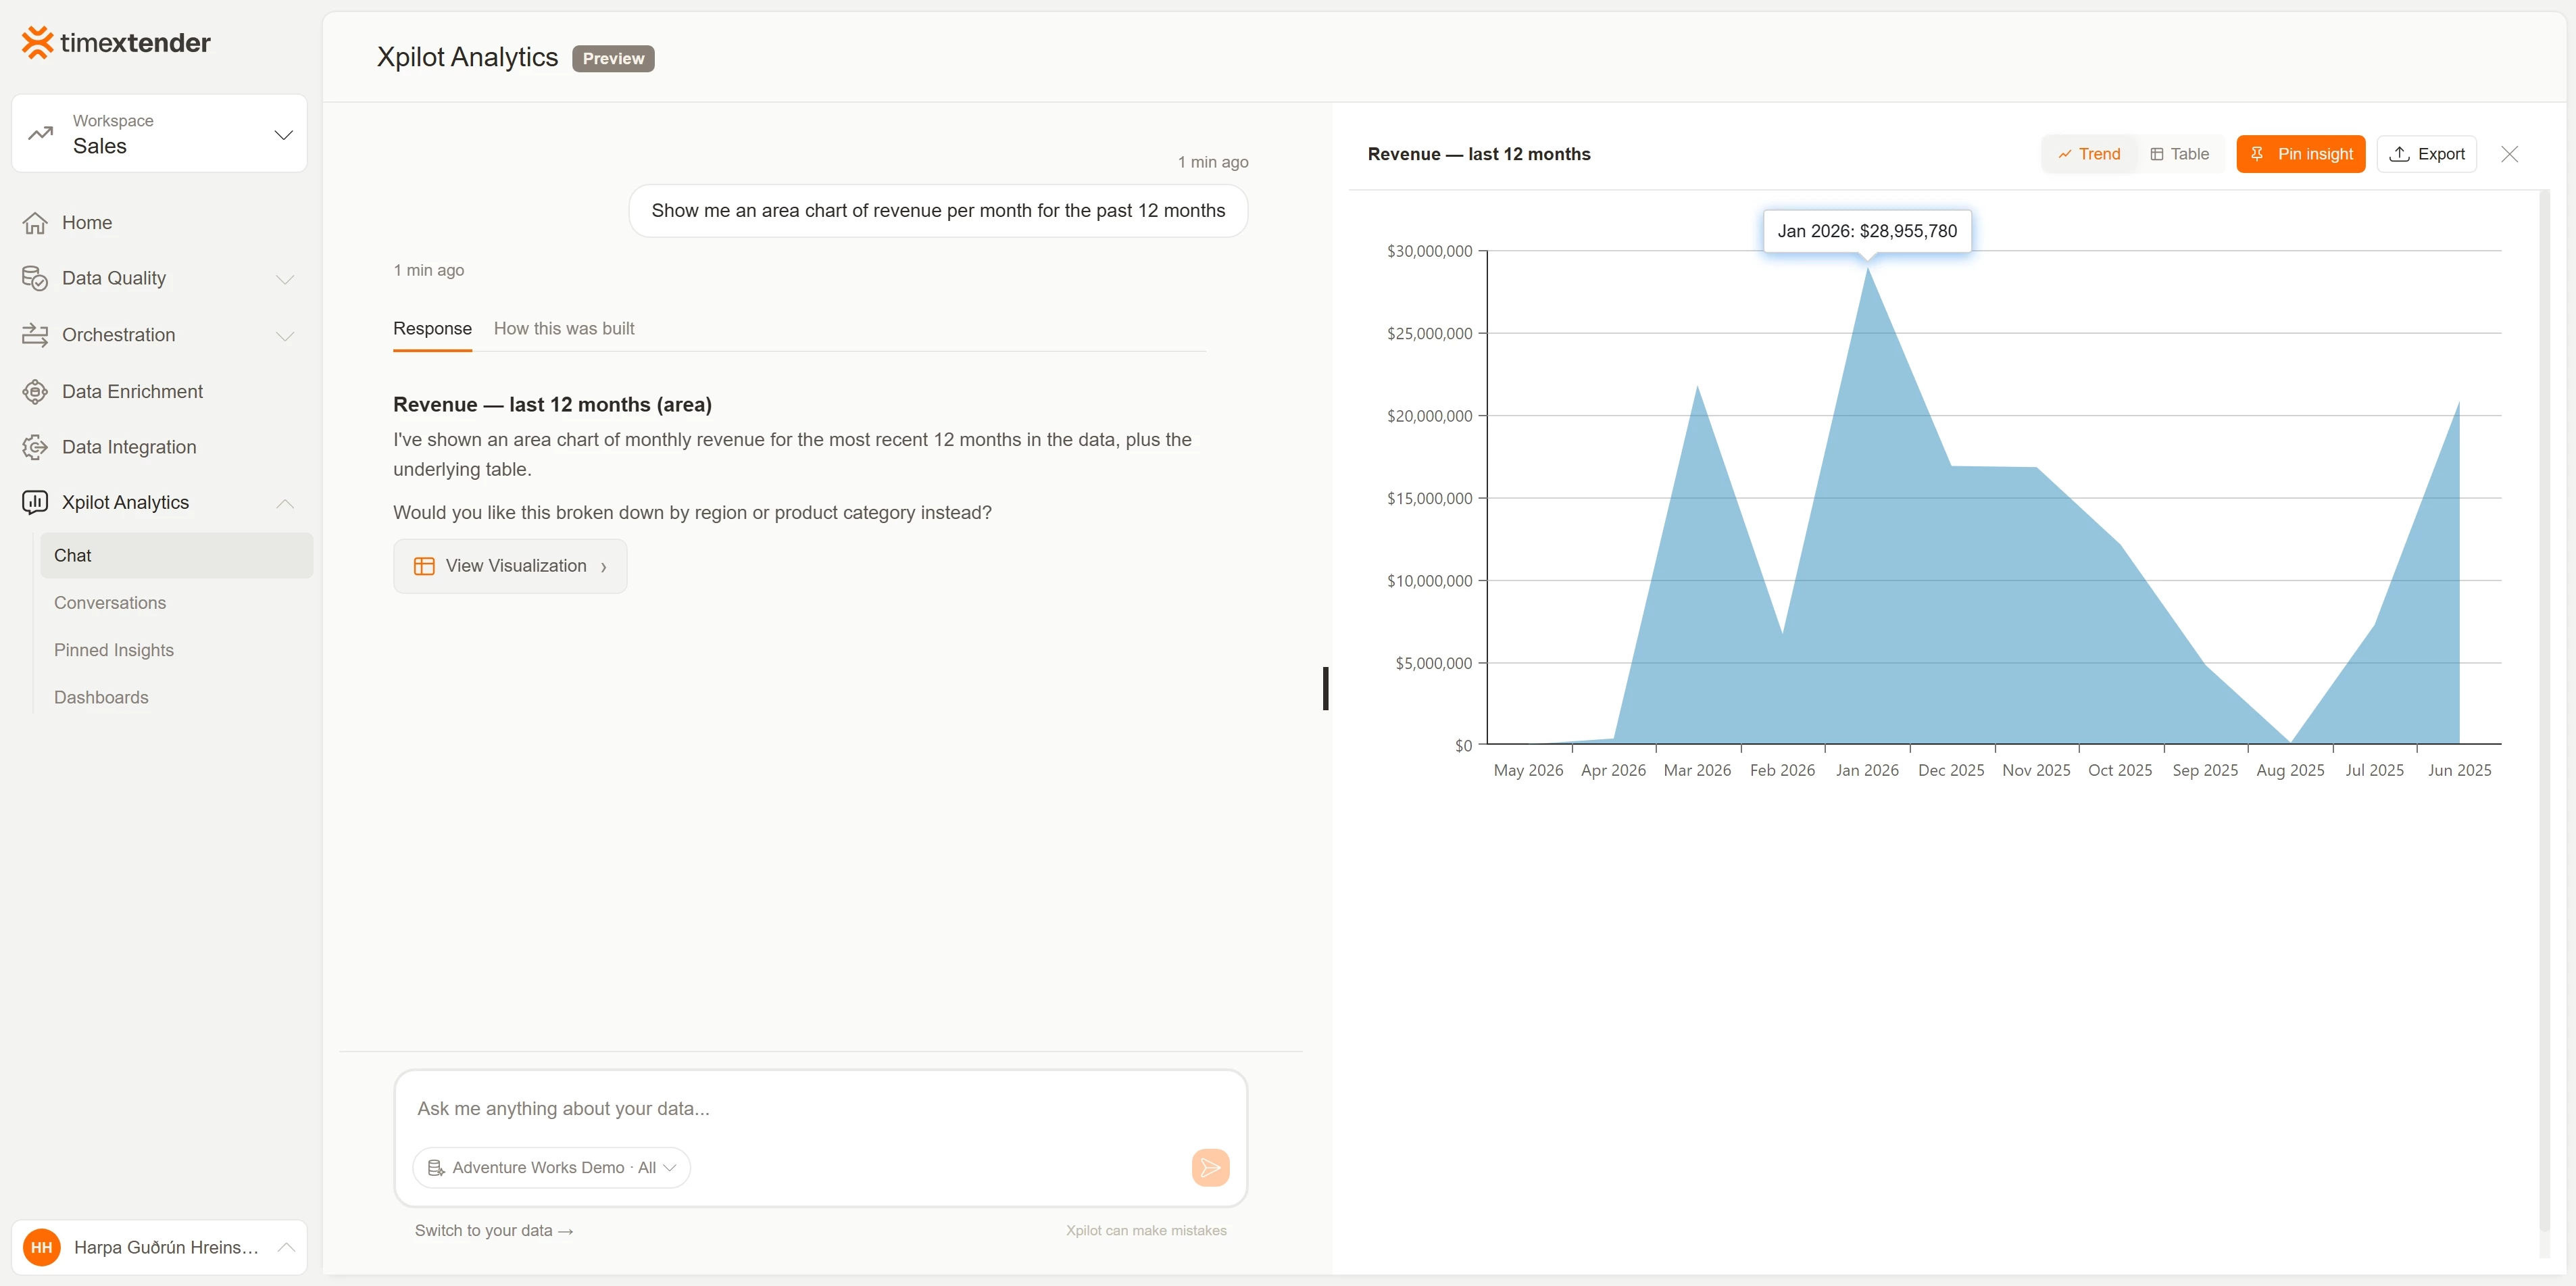
It is not guessing at your raw tables. The numbers come from the measures, descriptions and relationships your team authored once in the Deliver instance, so an Xpilot answer and the report a colleague pulled this morning line up by design. Every response carries a How this was built tab showing the SQL it wrote, and the connection is read-only: the MCP server in front of your database rejects every write before it reaches the database.
This article gets you from nothing to your first answer. It takes about half an hour, most of which is installing the MCP server.
Getting started
| Requirement | Notes |
|---|---|
| TDP 26.2 or newer | Check Settings → Service → General → Version. Xpilot Analytics ships in 26.2. |
| An administrator account | Needed for steps 2 and 4. Everything after that works for any user with workspace access. |
| A TimeXtender MCP Server | A small service on a machine that can reach your data warehouse. Not needed to try Xpilot with sample data. |
| A semantic model | A Deliver instance with an MCP semantic endpoint. If your team already publishes semantic models, you have this. |
Step by step
1. Get on TDP 26.2 or newer
26.2 reaches customers on a gradual rollout, so you may already be there. Open Settings → Service → General and read the Version field.
If you are on an older version and want Xpilot Analytics now, email support@timextender.com and include your TDP service name so there is no ambiguity about which service to move.
2. Turn on AI features
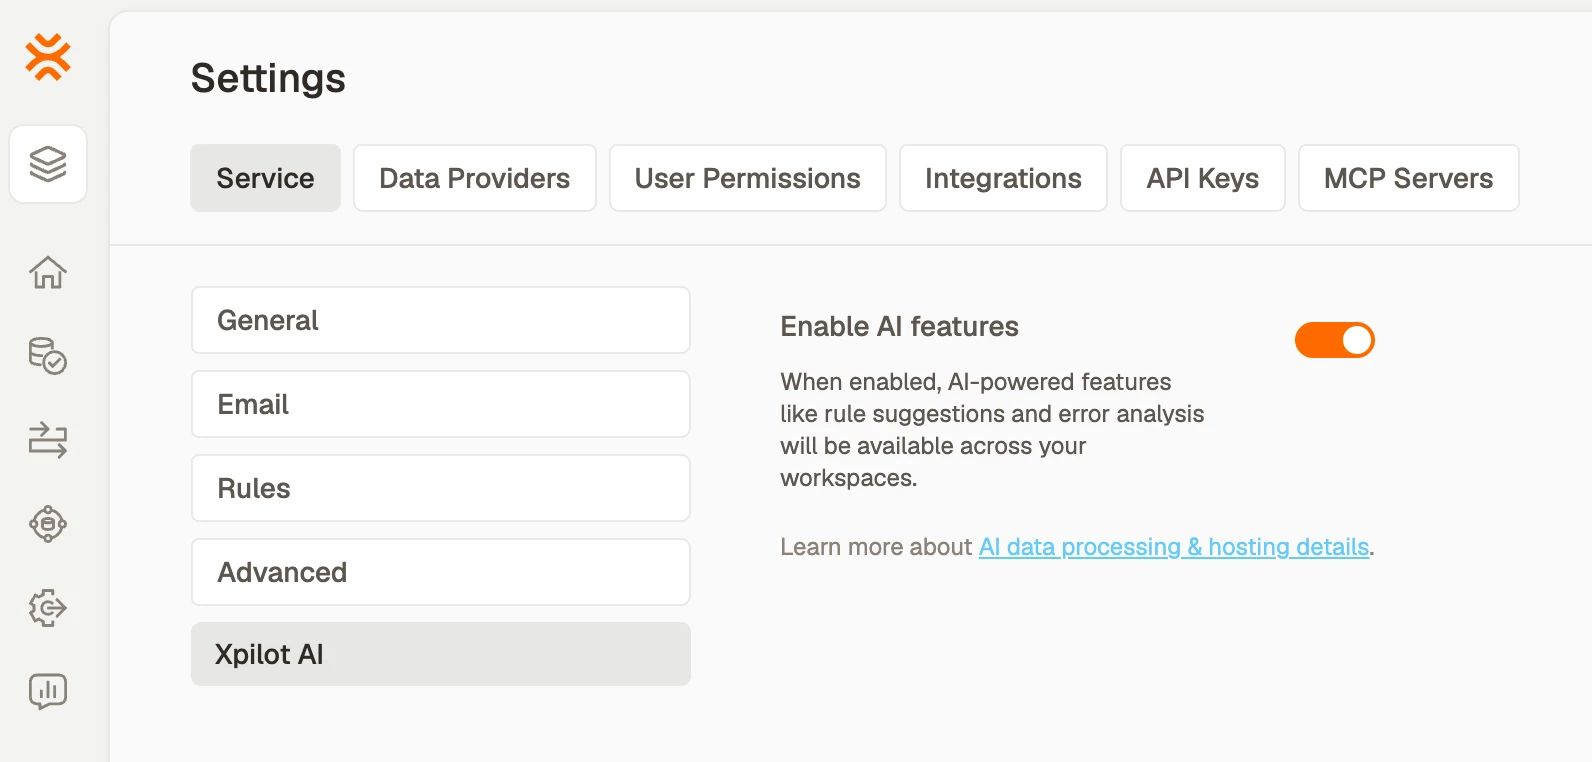
An administrator opens Settings → Service → Xpilot AI and switches on Enable AI features.
This one switch covers all of TimeXtender's AI features — rule suggestions, error insights and Xpilot Analytics — across every workspace in your service. Turning it on does two visible things: Xpilot Analytics appears in the left navigation, and an MCP Servers tab appears in Settings. You need both for the steps below, which is why this comes first.
Before you flip it, you may want to read AI Features: Data Security & Trust — it covers exactly what leaves your environment, where it is processed, and what it is not used for.
You can stop here and try it
Open Xpilot Analytics → Chat and click Try with sample data → below the input. You will be asking questions of a pre-built Adventure Works dataset in seconds — same chat, same charts, same How this was built detail, just demo data. No MCP server required. Steps 3 and 4 are only for pointing Xpilot at your own data.
3. Install and register the MCP server
The MCP server is what lets Xpilot query your data through TimeXtender's secure cloud relay. It runs on a machine in your environment, and installing it is a one-time job covered by its own guides:
- Configure MCP Semantic Endpoint — the Deliver-instance side: create the endpoint and publish a semantic model.
- Configure MCP Server — install the server and the Configurator, and connect it to your database with a read-only account.
Then register the running server with TDP, in the MCP Server Configurator on that machine:
- Open the TimeXtender Data Platform tab and click Connect to TimeXtender Data Platform. Your browser opens; sign in with your TimeXtender administrator account and complete MFA if your organization requires it.
- Pick your Tenant and enter a Server name — lowercase letters, digits and hyphens, 2 to 64 characters. The default is the machine's hostname.
- Click Connect and wait for the green Connected badge.
- Restart the MCP Server service from the Service Management tab so the registration takes effect.
Full detail, including how to pause, move or re-register a server: Register MCP Server with TimeXtender Data Platform.
4. Give your workspaces access
A registered server is invisible until you say which workspaces may query it. As an administrator, open Settings → MCP Servers.
- Find your server in the grid. Status reads Online when the machine can reach the cloud, Offline when it can't.
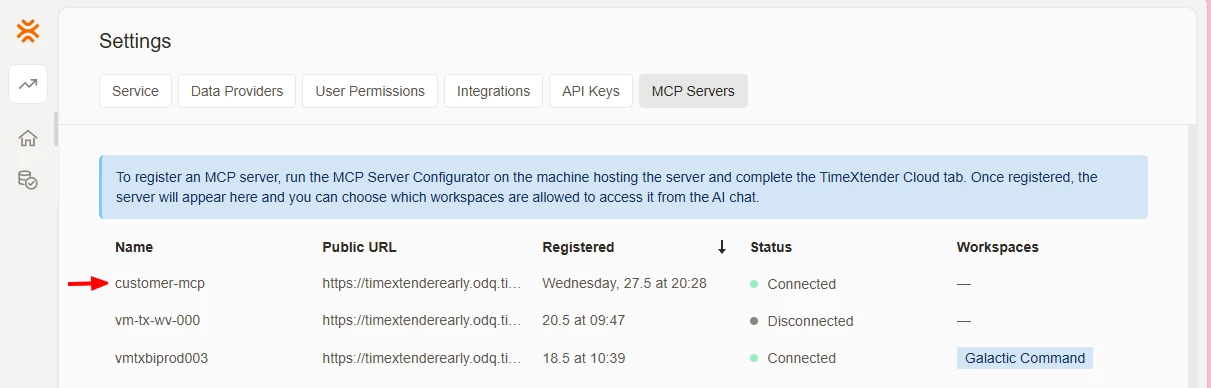
- Click the row, then under Workspaces with access select the workspaces that should be able to ask questions of this server. Selecting all of them displays as All workspaces.
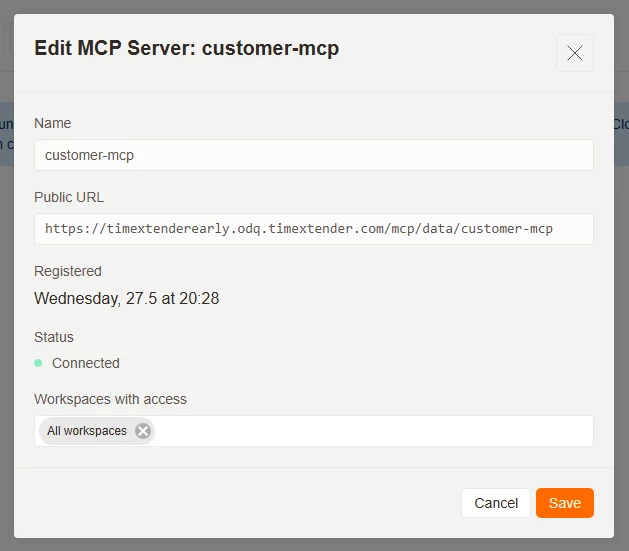
- Click Save.
5. Ask your data
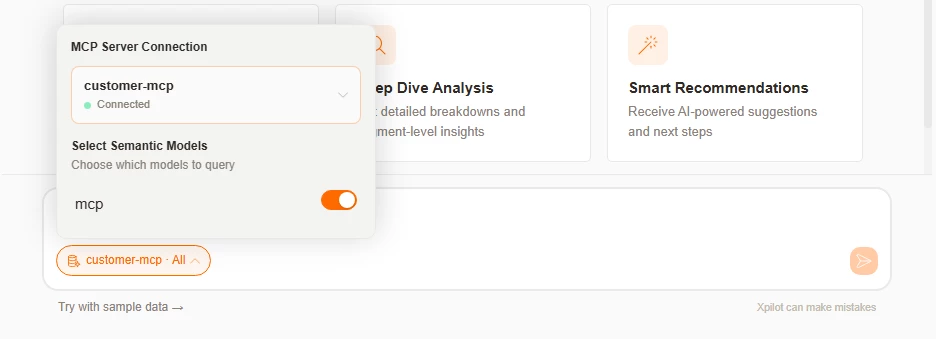
Open an allowed workspace and go to Xpilot Analytics → Chat. The pill above the input shows which server and model you are connected to; click it to switch servers or narrow Xpilot to specific semantic models.
Good first questions are specific and bounded:
- “What were our top ten customers by revenue last quarter?”
- “Show me revenue by region over the past year.”
- “How did sales trend month over month this year?”
Open How this was built on the answer to see the SQL Xpilot wrote before you rely on it. When an answer is worth keeping, click Pin insight — Xpilot captures that exact query, so refreshing the pin next Monday re-runs the same logic against newer data instead of reinterpreting your question. Collect pins into a Dashboard and your team has numbers they can return to.
Going deeper
Chat with your data
Open Xpilot Analytics inside a workspace and you'll see the chat with a single text box: "Ask me anything about your data...". The pill above the input shows which server and model you're connected to, something like "My Server · Auto". Click the pill to switch servers or pick specific semantic models (the views Xpilot will query against).
Ask Xpilot something like "What were our top ten customers by revenue last quarter?" and it will pick the right query, run it against your semantic model, and reply with the answer plus a chart and a sortable table.
Each response has two tabs: "Response" is the answer; "How this was built" walks through every step Xpilot took (the SQL it wrote, the parameters it used, the data it received) so you can verify the result before trusting it. On harder questions Xpilot will show "Thinking..." while it reasons, and disclose the full reasoning trace afterwards if you want to see it.
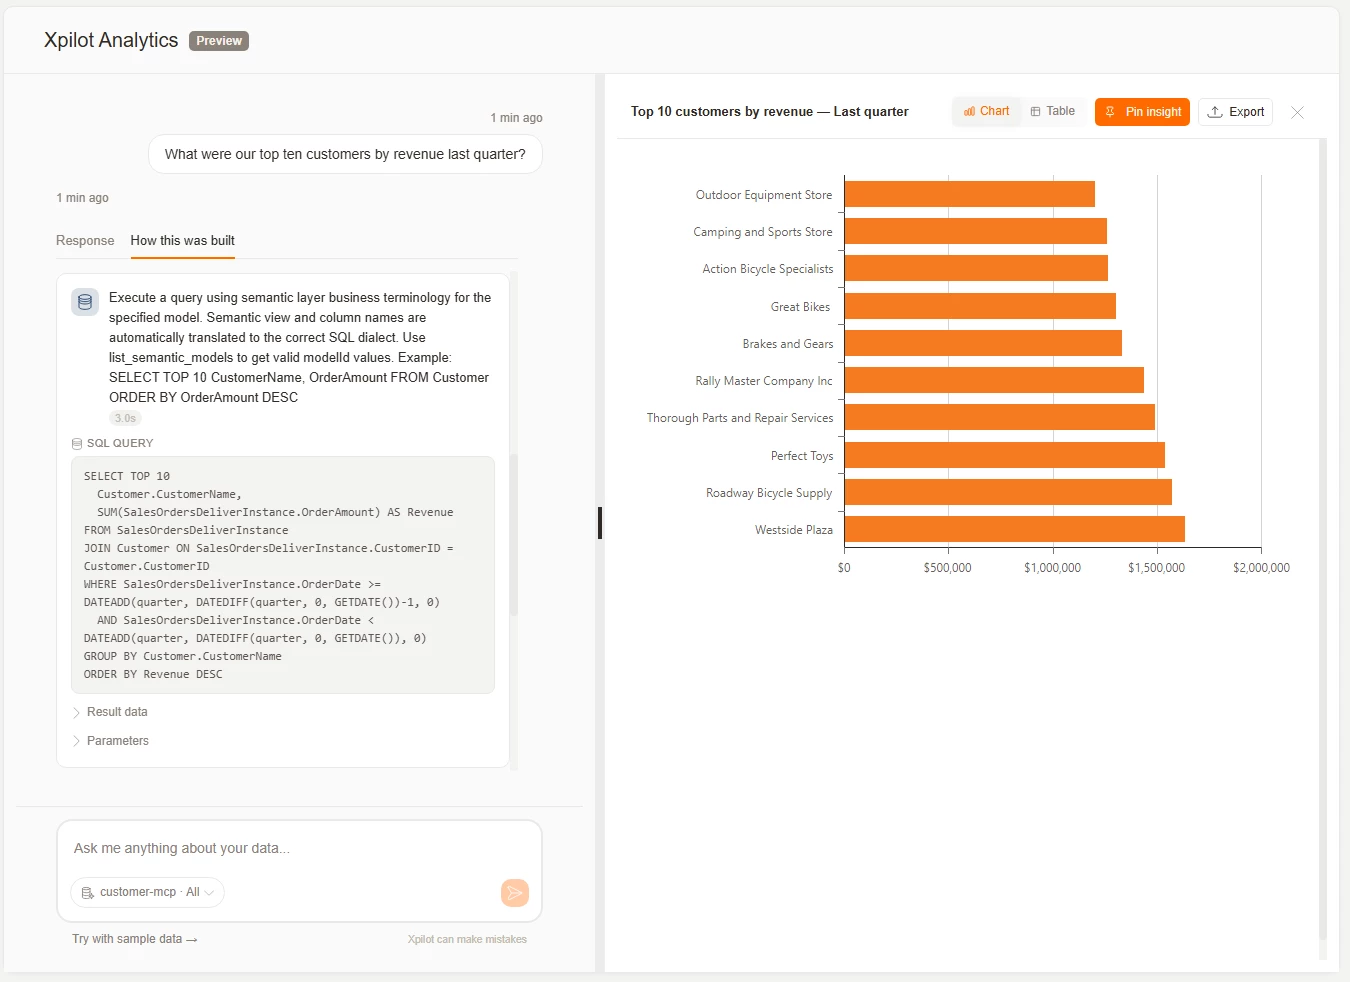
The SQL you see in "How this was built" is the same SQL Xpilot captures when you pin an insight, which is what makes pinned insights and dashboards reliable to refresh later.
Xpilot can draw bar charts, line charts, pie charts, KPI cards, and tables. From any chart pane there's an "Export" menu with PNG, PDF, CSV, and XLSX options. Conversations are saved automatically (find them under Conversations in the navigation) and they stay scoped to your workspace, so private analyses stay private.
A few things to know up front. Xpilot picks sensible defaults for time ranges, groupings, and chart types when you don't specify them, drawing on the measures and descriptions your team has authored in the semantic model. The richer the model, the better the chat.
Follow-up questions remember the context of the conversation, so you can refine without restating. And Xpilot can be wrong: you'll see "Xpilot can make mistakes" below the chat input as a reminder to check the "How this was built" tab whenever an answer surprises you.
Tip. Xpilot's answers are only as clear as your semantic model. If the chat keeps misunderstanding a term, look at the description on that measure or column in TimeXtender Desktop and add the synonyms your team actually uses. The next deploy carries the improvement to the chat.
Try it with sample data first
If you haven't registered an MCP server yet, or you just want to explore what Xpilot can do, click "Try with sample data →" below the chat input. You'll land in a sandbox connected to a pre-built demo dataset (Adventure Works), with example prompts under "TRY ASKING ME..." that give you a sense of what kinds of questions work well.
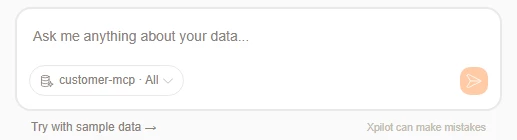
The sandbox behaves exactly like the real chat (same visualizations, same conversation history, same "How this was built" detail), just against demo data instead of yours. When you're ready to switch back, the footer link becomes "Switch to your data →".
Pin the insights worth keeping
When a chart or table answers a question you'll come back to, pin it. Open the visualization in the side pane and click "Pin insight". Xpilot stores the question, the SQL it generated, and the visualization together. Give it a clear name (and a description if it helps your team) and click Pin.
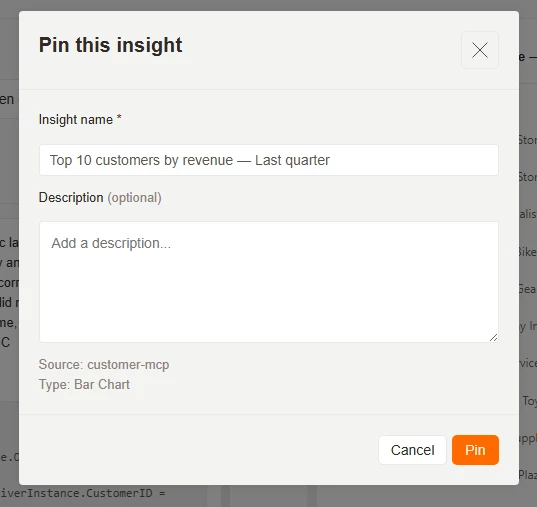
Find your pins later under Pinned Insights in the navigation. Each pinned insight has its own page where you can:
- Refresh the data, re-running the captured query against your live source.
- Verify the insight: your name is recorded as the verifier, so your team knows the result has been double-checked.
- Open the original question and Xpilot's reasoning behind it.
- See the SQL Query Xpilot wrote, exactly as it ran.
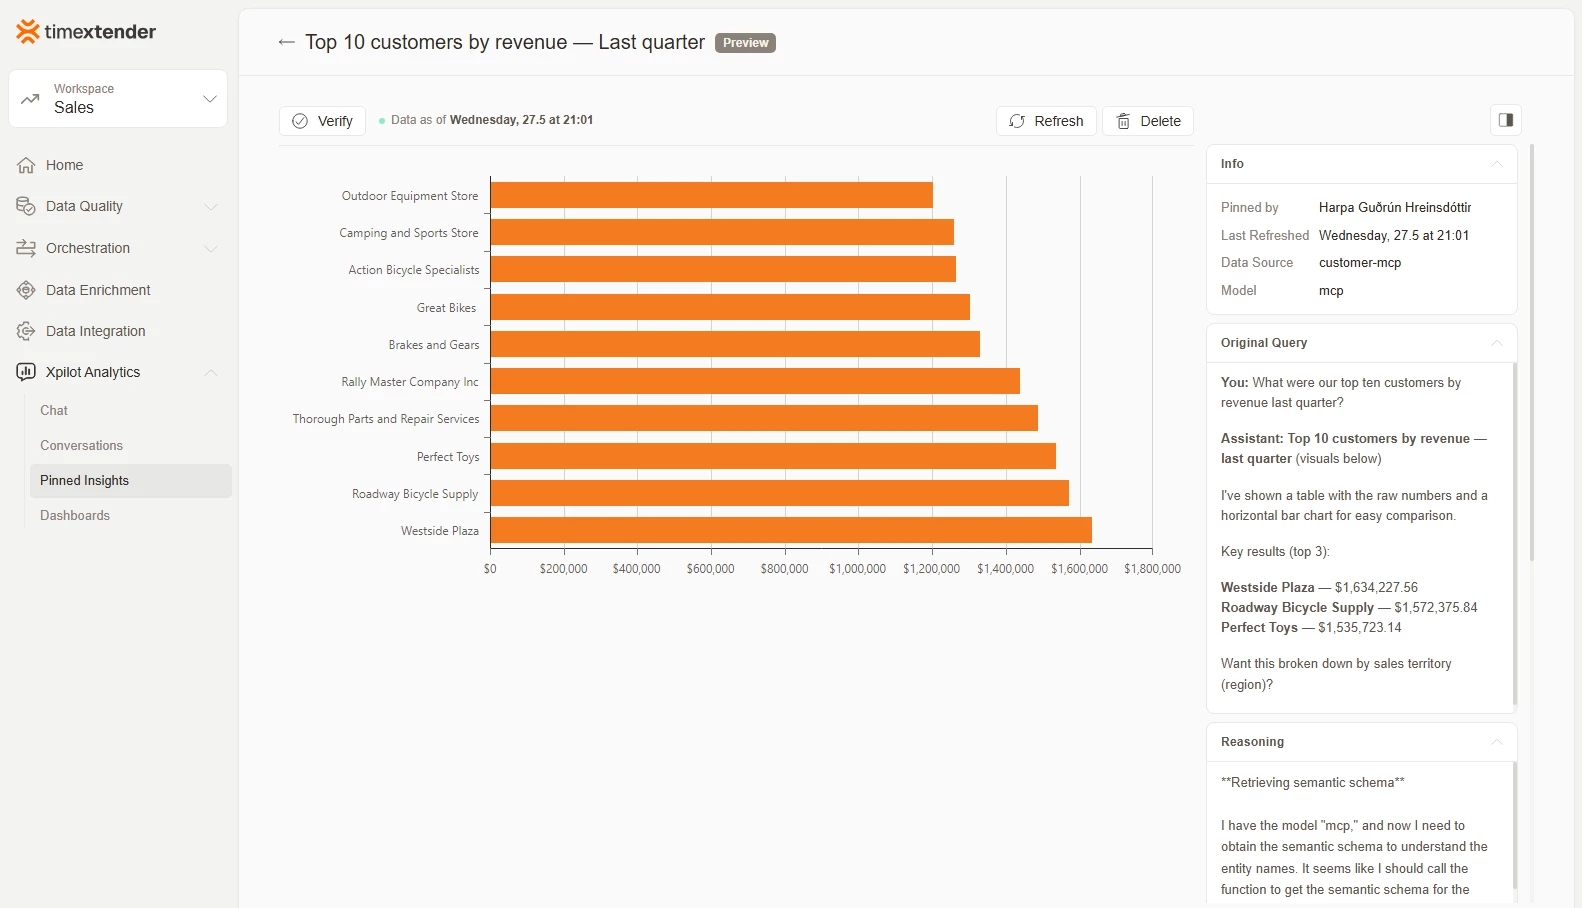
Here's what makes a pinned insight different from re-asking the chat:
|
| Chat conversation | Pinned insight |
|---|---|---|
| What's captured | The conversation itself | The exact SQL Xpilot ran |
| When you re-open it | Xpilot can reinterpret | Refresh runs the same query |
| Best for | Exploring, refining, ad-hoc | Numbers your team comes back to |
That's why verification carries weight. Once your team has checked the query behind an insight, that check holds for every future refresh.
Over time, your pinned-insights library becomes a record of the questions your team has decided are worth coming back to. Verified pins are the questions worth standing behind. The more your team curates, the faster anyone new to a workspace can find a trustworthy answer. Pinned insights stay tied to the MCP server and model they came from. If that server goes offline, the pin will tell you. You'll still see the data from the last refresh, just not pull anything fresher until the server is back.
Build dashboards that answer questions
A dashboard is a curated set of pinned insights laid out side by side. Open Dashboards in the navigation and click "New Dashboard". Give it a name and description, then start adding insights.
Click Edit on a dashboard and you can drag cards to reorder, remove cards with the × button, or click "Add Insights" to pick more from your pinned-insights library. When you save, each card loads live data by running its captured SQL directly against your MCP server. The chat agent doesn't participate. "Refresh all" at the top re-runs every card the same way, with a freshness indicator across the board: "Data as of {timestamp}".
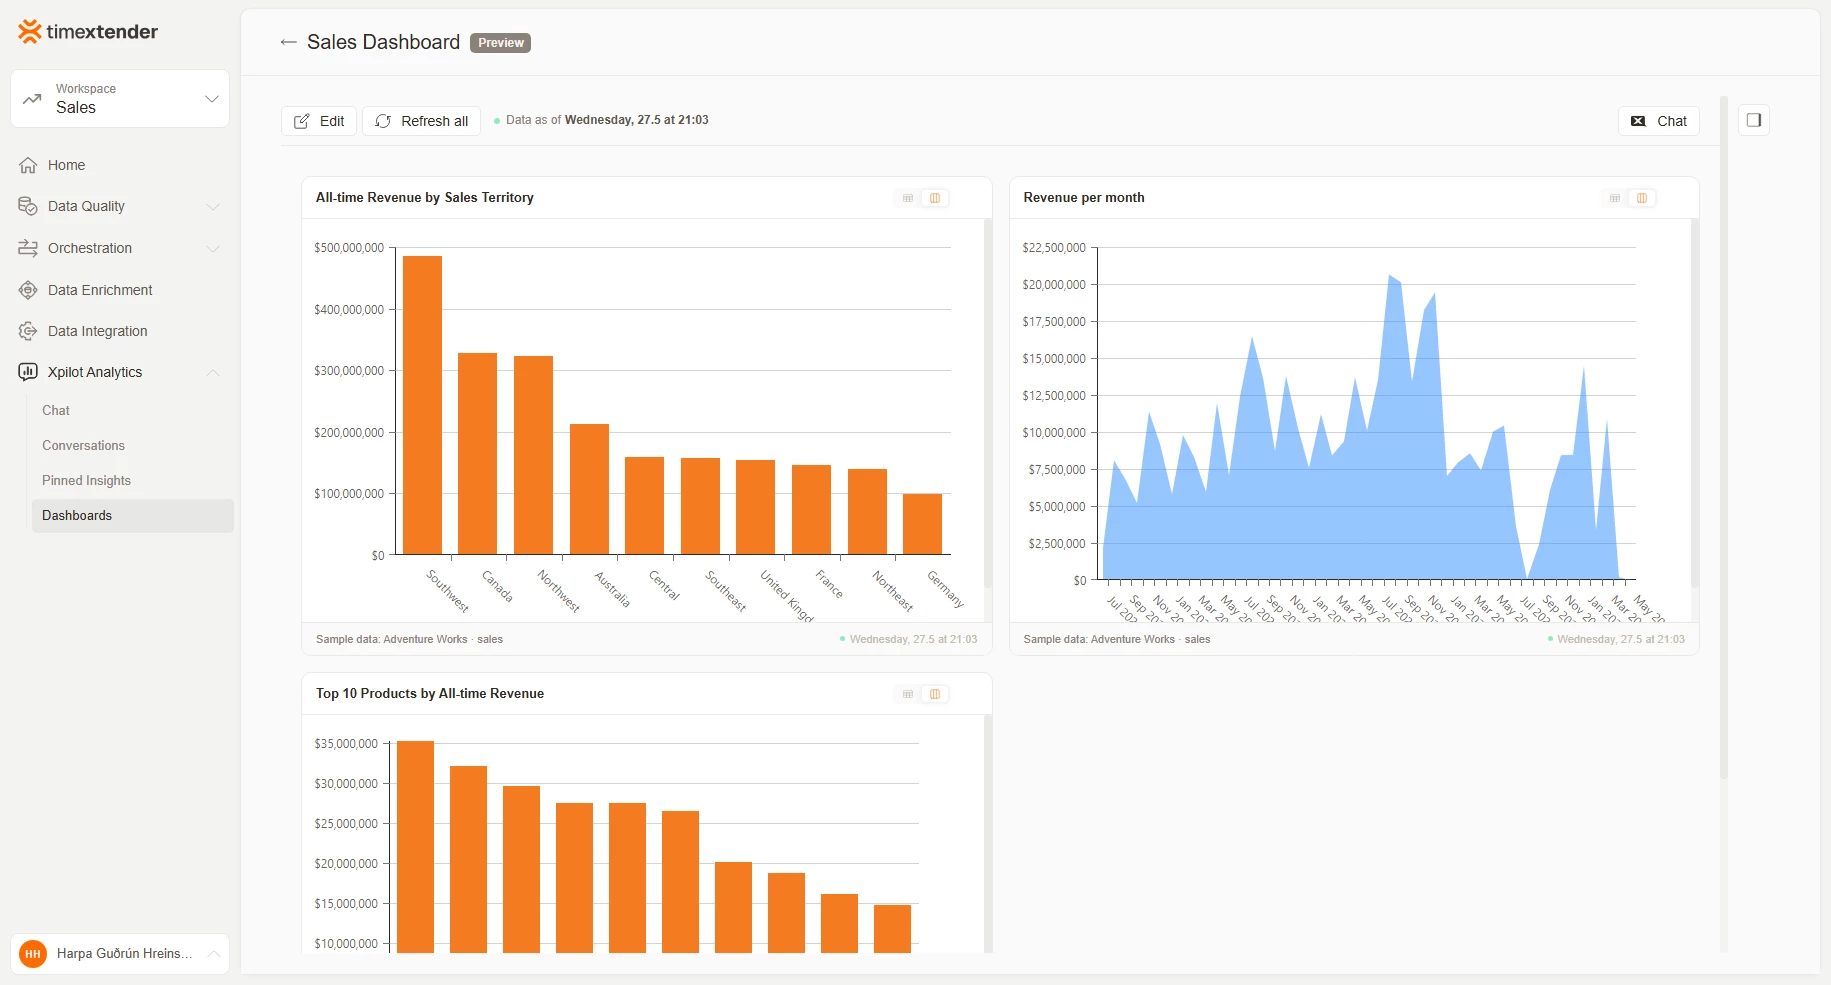
Dashboards are the natural home for the things you check every week: top-line metrics, recent trends, anything you'd otherwise rebuild from memory each time. Verified insights are flagged with a green badge, so it's clear at a glance which numbers your team has stood behind. The combination of reproducible queries, governed semantic models, and human verification is what makes these dashboards trustworthy enough to drive decisions, not just visualise them.
Chat about your dashboard
Click the Chat button at the top right of the dashboard and a side panel opens labeled "Chat with dashboard", showing how many of your insights are in context. Ask things like "why did the spike happen in March?" or "which of these changed the most quarter over quarter?", and Xpilot answers using only the data and SQL behind the cards on this dashboard.
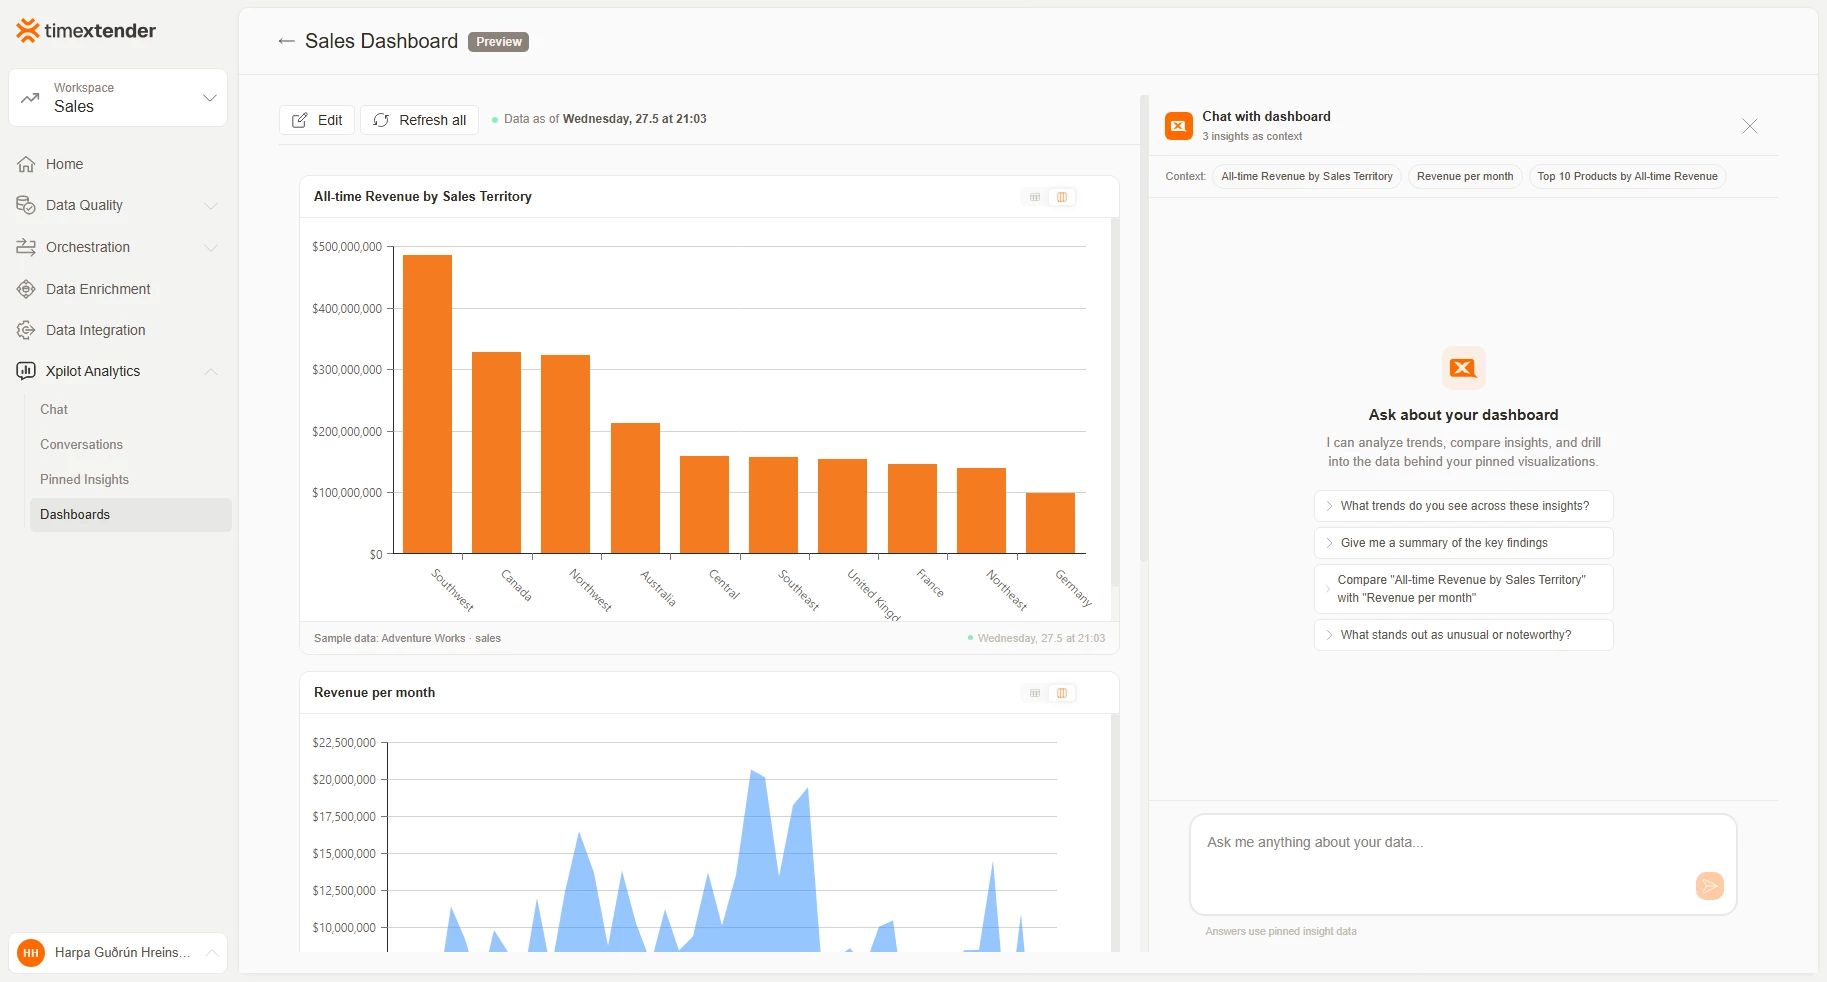
The footer below the input reads "Answers use pinned insight data": this conversation is grounded in what you're looking at, not a fresh trip out to the full semantic model.
Frequently asked questions
Can I ask Xpilot anything, or just questions about my data?
Xpilot is built for questions about the data exposed by your semantic models: sales, customers, revenue, operations, whatever your team has modeled. It will politely decline questions that aren't data-related, and it doesn't browse the web or look anything up outside your data.
Is the chat allowed to change my data?
No. Xpilot Analytics is read-only by architecture. The MCP server in front of your database rejects every write operation (INSERT, UPDATE, DELETE, CREATE, DROP, ALTER) before any query ever reaches the database, and the database connection itself uses a read-only account. You can put Xpilot in front of anyone on your team without worrying that a question typed in plain English could damage what's behind it.
My MCP server is registered but I don't see it in the chat. What's missing?
You probably haven't allowed your current workspace to use it yet. Open Settings → "MCP Servers", click your server, and add your workspace under "Workspaces with access". The chat picks it up the next time you load.
What's the difference between sample data and my data?
Sample data lives in a pre-configured demo MCP server that everyone shares: Adventure Works data, no setup required, but obviously not your real numbers. Your data flows through an MCP server you (or your admin) registered on a machine in your environment, connected to TimeXtender Cloud over a secure relay. Same chat, same visualizations, just pointed at different data sources.
Can I edit a pinned insight later?
You can rename it, change its description, verify or unverify it, and delete it. You can't change the underlying SQL. Pins are snapshots of the query Xpilot ran. If the analysis needs to evolve, ask Xpilot the refined question in a new conversation and pin the new answer.
If I refresh a pinned insight or dashboard card, will I get the same numbers as before (when my data hasn't changed)?
Yes. The SQL Xpilot wrote when you pinned the insight is captured and stored with the pin. Every refresh runs that same SQL straight against your MCP server, bypassing the chat agent entirely. The shape and logic of the answer never drift; only the numbers move as the underlying data changes. That's the difference between a pinned insight and re-asking the chat: the chat is creative on each turn; pins are reproducible.
Can I export a chart or download the data?
Yes. From the visualization side pane there's an "Export" menu with PNG, PDF, CSV, and XLSX options. Xpilot itself won't email or schedule deliveries; export and sharing is something you drive from the visualization pane.
Where does my conversation history live?
Every conversation is saved to your workspace. Find them under Conversations in the navigation; titles are auto-generated from your first question. Conversations stay scoped to your workspace, so people in other workspaces can't see them.
Troubleshooting
"Welcome to Xpilot Analytics" appears even though I registered an MCP server.
The server is registered to your tenant, but your current workspace isn't on its allowlist yet. Open Settings → "MCP Servers" as an admin and add your workspace under "Workspaces with access". Non-admins can click "Copy details for admin" to send the right context to whoever can change the setting.
"'{Your server name}' is offline" appears in the chat.
The MCP server machine isn't reachable from TimeXtender Cloud right now. Admins can open the server on the VM that hosts it and click "Recheck connection" in the chat. The Configurator on that machine will show whether the relay is Connected, Paused, or in an error state.
"MCP server isn't responding. Check the connection and try again."
This is the chat's fast-fail when a tool call can't reach the on-prem server. Same fix as above: make sure the MCP server service is running and the relay shows Connected in the Configurator.
"Couldn't render this {chart type}. The tool call returned malformed or truncated arguments. Try a narrower query (fewer rows or columns)."
Xpilot tried to draw a chart with too much data. Ask for a smaller slice (narrower time range, fewer dimensions, top-N rather than everything) and the visualization will render cleanly.
"Request timed out. Try a more focused question, or try again." or "This question is taking too long to answer. Try a more focused question, or break it into smaller steps."
Xpilot has about two minutes to produce an answer; very broad questions can blow past that. Splitting the question into two (first one to scope the data, then a follow-up to dig deeper) usually works better than rephrasing the original.
"The response was too long to complete. Try asking for less data, or a more focused question."
Same idea. Ask for a more focused slice. Top 10 instead of everything; this quarter instead of all time.
Open Xpilot Analytics and ask it something. Pin the answers worth keeping. Build a dashboard from a few pins. Refresh it next Monday and watch numbers move under an analysis your team has already verified.
