We have moved from on-premise to AZURE a few months ago. 
Our TX server is on a node in AZURE and so is our DWH.
I have observed that jobs that took a few minutes to complete when we were on-premise now takes much longer.

I am wondering if there is a way to person a “health-check” on TX?


Hi,

there isn’t much difference between checking performance on-prem and in Azure: evaluate VM, networking, database metrics to find what the likely source of slowness is and go from there. For Azure resources the Azure Portal is a place to start if you aren;t familiar with other tooling. For the database you would use SQL Server Management Studio or your favourite query-running tool.


Hi, 

What parts of your data warehouse are performing slower? MDW? ODX? Since you’re tagging your question with ODX I assume the latter. In the case of ODX and the use of Azure Data Factory, you could experience slower throughput times for (small) tables compared to the business unit approach since Azure Data Factory pipelines require a spin-up-time. Throughput times can also increase when you load incrementally and don’t use the roll-up feature to periodically merge the incremental files. For ODX I think it’s a matter of tweaking your ODX server settings, SQL database setting (in case of ingestion from ODX) and Azure Data Factory integration runtime compute settings to achieve or improve on your on-premise performance. 


@rogier.helmus 
Sometimes its ODX and other times its DSA and MDW.

I have noticed that Data Cleansing is a long process.

I have worked with Informatica and AWS before. With Informatica i could see if its writing to “landing” becasue DB starts to fill up. I cant see this TX so i dont know if there is something going on or not.

Can someone please also guide me if REPOSITORY DB needs to be the same capicity as ODX?

Our reposity is 2 vCores whike ODX is 4 vCores


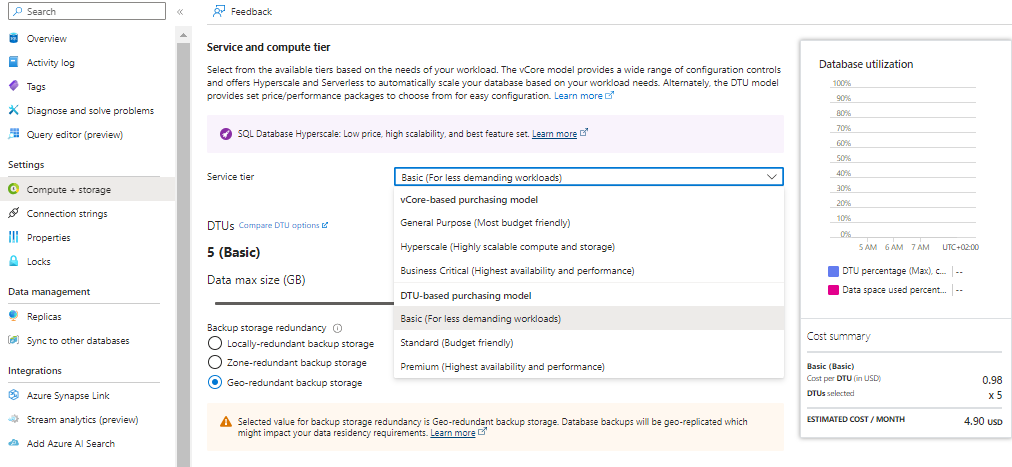
@aftabp which Azure sql database service tier are you using for the ODX, DSA, MDW and Respository DB?

As mentioned above please try to check the db metrics in the azure portal to see if there are any bottlenecks on your Azure sql databases to determine if they need to be scaled up. Alternatively you can run a test scaling up your databases temporarily to see if performance improves. 


Hi @aftabp do you have an update on the above? were you able to identify any bottlenecks when checking db metrics in the Azure portal?


I talked with team that set up DWH and DB-es. They were set-up under the recocmended settings. After we have doubled MAX and quadruple MIN cores on our ETL database, things are looking better but i still see jumps in I/O


Also, the repository is 2 vCore. Should we keep it that way or increase it too?


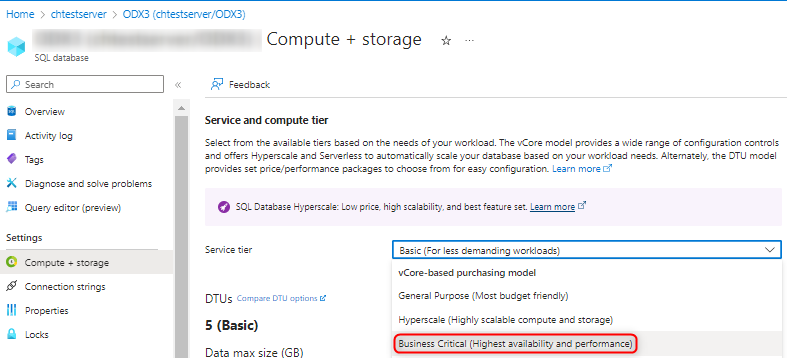
@aftabp Please test with Business Critical service tier, as this has higher IO limits: https://learn.microsoft.com/en-us/azure/azure-sql/database/service-tiers-sql-database-vcore?view=azuresql

Please also ensure that Min vCores and Max vCores are set to the same level.

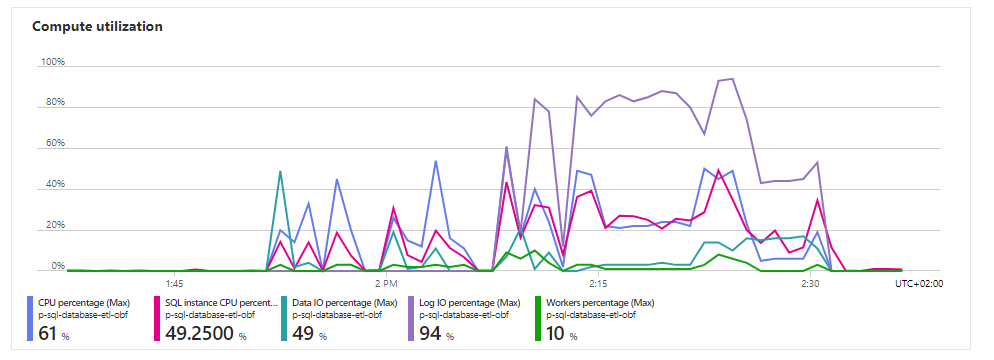
The metrics screenshot is this for your DSA? Do you see similar IO spikes for ODX and MDW databases?


Thank you @Christian Hauggaard 
I have send this to our Solutoins Architect 


@aftabp @Christian Hauggaard ,

Also try the hyperscale. Like @rory.smith said on Xtend 2024: IO usually is the bottle neck and hyperscale is the best option. I do not have his notes (and therefore no specifics) on hand, but really worth trying.


@aftabp as for slow data cleansing:
Do you use a lt of look ups? Do you use aggrigations in them? 
Do you use supernatural keys?
Heavy transformations like windowed functions and such?
Do you use a lot of views? Maybe views in views?
other ‘not TX naitive’stuff like UDF or Stored procedures or custom table inserts?


@daniel I need to check this more thoroughly.


@rory.smith and @daniel 
Thank you for the suggestions.
I have just had a word with the Solutions Architect and we are going to try Hyperscale for out ETL database (this is where all the data is ODX, DSA and MDW)

In additon to this we also have an other DB which writes back from PowerApps. Does this need to be a hyperscale too? 

What about Repository?


Hi @aftabp ,

2 vCore for the repository should be more than enough if you clean execution logs regularly. It will only start slowing down on very large projects or with many versions stored. For smaller implementations 50 DTU could also be enough for the starting / initial implementation period.

The main benefit from Hyperscale is the Log I/O being higher - in your metrics chart you can see a short period where it reaches above 90%. I wouldn't worry about small spikes of Log I/O reaching 100%, as long as it is not pegged at that level or your waits start indicating I/O Governor as a major contributor.

There is (in preview) now also Premium Managed Instance which can have (at higher scalings) more Log I/O at 192 mb/s. This is more costly than Hyperscale which always has 100 mb/s.

Depending on the transformations you are doing you may need to add indexes to speed things up, checking Custom Views and Aggregate tables is a good start. As your CPU seems the most consumed item I would stay away from table compression for now, you may want to experiment with lowering threading though.


@rory.smith 
Can i create a stored procedure in ODX to clear logs older than 90 days?
There is a post about it but i am not sure if this also applies to legacy!

I want to create a schedual that runs (lets say) once a week and delete logs older than 90 days,


Hi @aftabp ,

when using a Business Unit in 20.10.x you can clean the Execution Logs for BU and DWH through the repository administration tool. When using the ODX Server with 20.10.x I am not actually sure whether that is done automatically by TimeXtender in the remote repository (I expect so).


Reply