Solved

TimeXtender API Endpoint questions

  • 16 October 2023
  • 3 replies
  • 77 views

Hi, we are trying to use the TX API endpoint (https://support.timextender.com/timextender-portal-111/timextender-api-endpoints-1110) to check whether TimeXtender jobs have run or failed (or have warnings). We want to check this with Zabbix monitoring tool.

For this check, we are only interested in the last run of a job. The TX API gives us a number of functions, like:

  • GET /public/jobs/{job_id}/status: this only gives status none, pending and running. Not failed, errors, warning, ok et cetera….
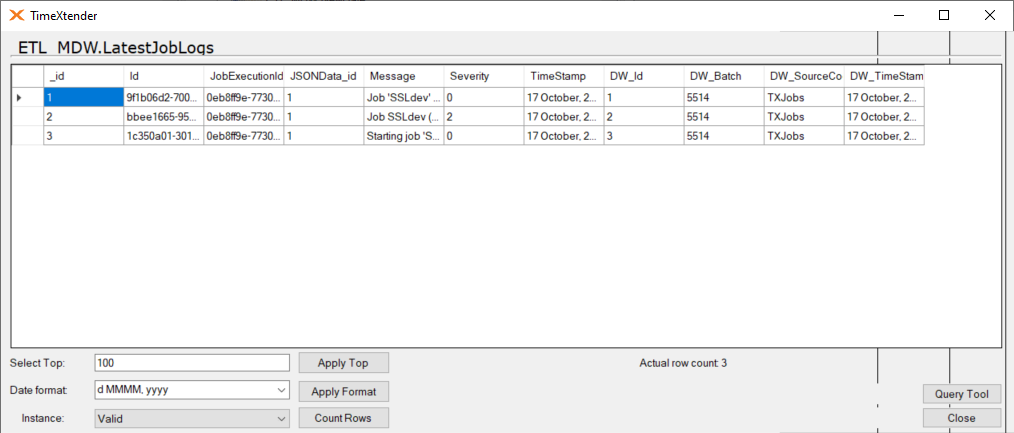
  • GET /public/jobs/{job_id}/logs: this one gives status like completed, failed, warning. But it gives the status of al jobs that have run the last weeks. It also shows ‘severity’ as a property, but it's not documented what different severity states mean.

Questions:

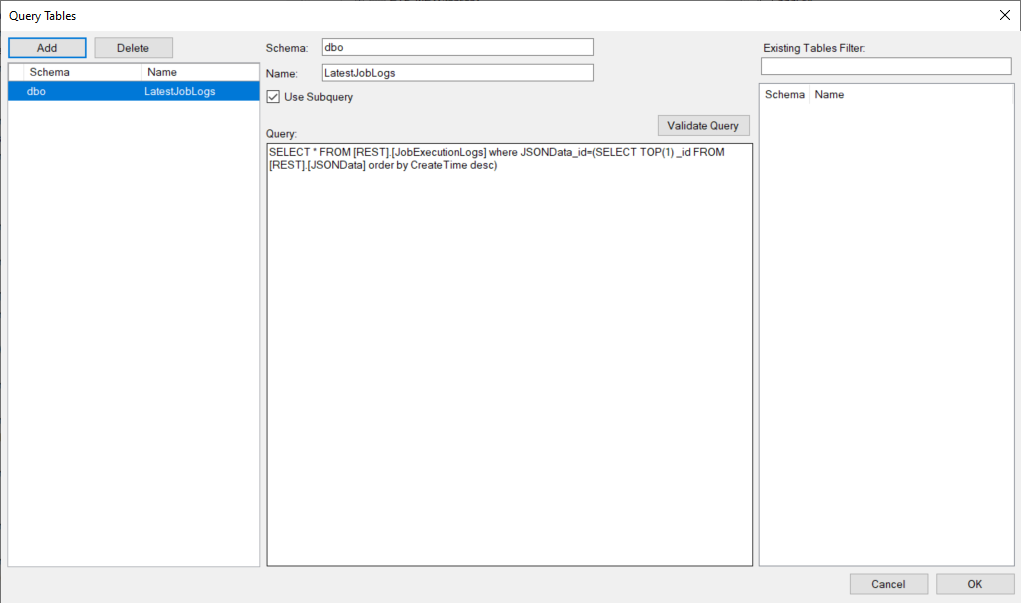
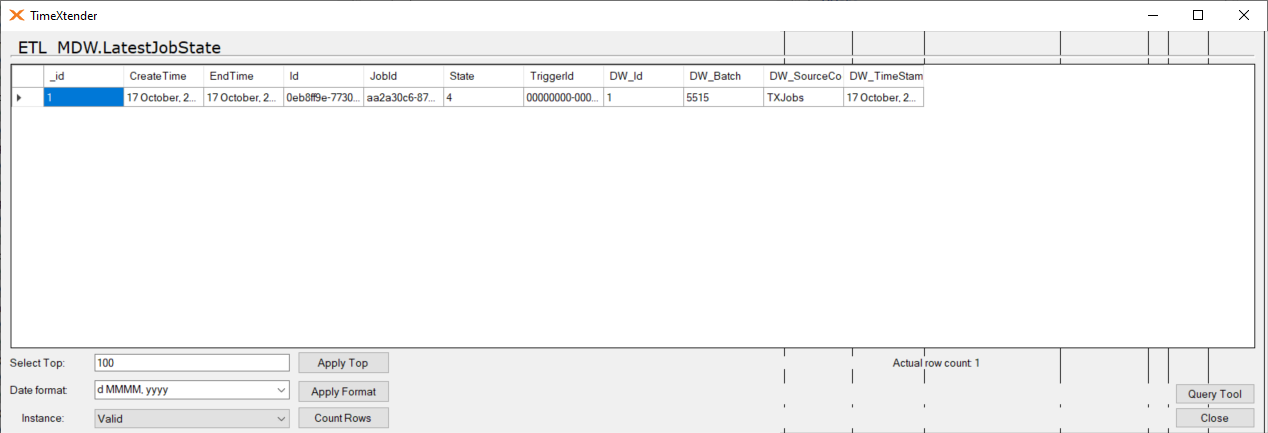
  1. How can we filter in job logs, so we only get the last execution with status of the execution (errors, failed, ok, ...) ? 
  2. What do different severity states (0,2,..?) mean?

Our main goal is to get the status of the last job exectution.

Thanks!

icon

Best answer by Christian Hauggaard 17 October 2023, 12:58

View original

3 replies

Userlevel 6
Badge +5

Hi @rick.hilbrands 

I have created a REST data source with the following properties:

URI (where aa2a… is replaced with your jobID)

https://apim-txportal-prod.azure-api.net/public/jobs/aa2a30c6-87eb-4148-b215-7ca2e19a8b6b/logs/

Custom Headers (where xyz should be replaced with your API key)

apiKey:xyz

Data Model

FlattenedDocuments

Schema location

Set to folder (e.g. C:\Users\TestUser\Documents\rsd\TXjobs)

Generate Schema Files

OnUse


Once these have been set, right-click on the data source and select Manage Query Tables and add the following query table

SELECT * FROM [REST].[JobExecutionLogs] where JSONData_id=
(SELECT TOP(1) _id FROM [REST].[JSONData] order by CreateTime desc)

Then execute the sync and transfer task, which should return data similar to the following for the last run 

Furthermore, you can create a second query table which shows the state

SELECT TOP(1) * FROM [REST].[JSONData] order by CreateTime desc

The State code represents the following:

  • State (int) - the state of the execution.
    • The following states exist:
      • -1 - none
      • - created
      • - running
      • - completed
      • 3 - failed
      • 4 - completed with errors
      • 5 - completed with warnings
Userlevel 6
Badge +5

@rick.hilbrands regarding the severity the codes represent the following: 

0 - Information
1 - Warning
2 - Error

Hi, thanks for your replies. I managed to solve this using a powershell script to read the webservice (using connector https://apim-txportal-prod.azure-api.net/public/jobs/<jobid>/logs). Based on CREATETIME I've made a filter to only show job executions from last 24 hours. There is one thing I still don't understand. I want to filter only on job executions that have failed. Jobs that have failed do get a STATE=2. But jobs that completed successfully also get a STATE=2. I would expect that failed jobs have STATE=3, so I can filter on STATE=3 to show only failed jobs.

Now I do a full text search on words like ‘error’ and ‘failed’ to determine if the job has completed successfully, but that gives probably not 100% coverage… 

Is there another way to determine if a job has failed?

Reply