
SUBMITTED

Execution gantt-chart with on-demand data sources

  • May 3, 2024
  • 3 replies
  • 38 views

Forum|alt.badge.img+2

When you have a data warehouse execution that uses solely on-demand data sources, you might come across a rather odd gantt-chart in the execution log:
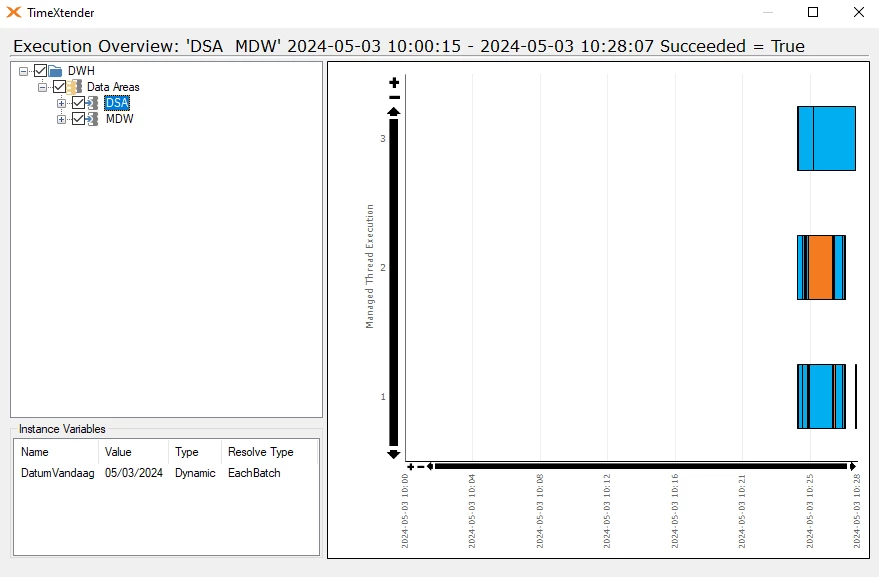
The table has a large blank space because of the use of on-demand data sources. If I am not mistaken, the blank space represents the ODX transfers that are initiated as a result of the on-demand setting.

What is the best way to monitor your DWH performance in this setting? The gantt-chart is a great tool to identify possible fixes in order to reduce the reload time of your DWH. In this case it becomes rather complicate to use it for that purpose.


3 replies

Christian Hauggaard
Community Manager
Forum|alt.badge.img+5

Hi @KajEmergo currently the best way is using the ODX execution log to monitor on-demand transfers. I agree having it displayed as part of the gantt chart would be useful, I will go ahead and convert this to a product idea


Forum|alt.badge.img+2
  • Author
  • Contributor
  • May 10, 2024

Hi Christian,

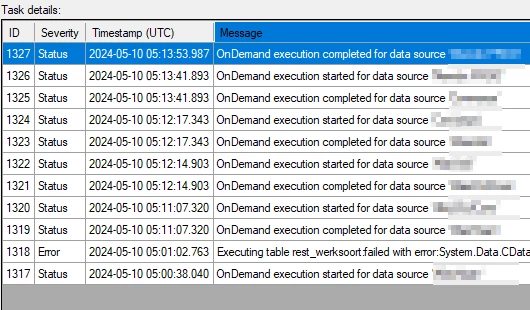
The outbound (merge transfer) from the ODX execution log only tells me the total duration for each data source (because there are timestamps for started and completed). It is still a lot of manual work to determine the largest table which takes the most time to load:


Thanks for converting this into an idea, would be nice to see it implemented in the gantt-chart.


Forum|alt.badge.img+2
  • Author
  • Contributor
  • May 10, 2024

@Christian Hauggaard I actually see that my colleague Andrew has already posted an idea regarding the ODX merge transfers: 

Can you merge my idea with his?