Solved

Decreasing ODX transfer time

  • March 12, 2024
  • 17 replies
  • 568 views

Hello,

TimeXtender 20.10.31.64
ODX: 20.10.31

We are currently running a database on hyperscale with 12vcores and premium memory optimized hardware. ODX is a data lake.

We are running execution packages on 4 threads and we want to reduce our odx transfer times as that is out biggest impact right now.

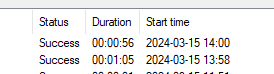
This is an example of a load. 


I am seeing long ODX transfer times for very small tables that I cant find the cause of or explain.

We have alot of small tables (see example below) that is taking 1-3 minutes, while some tables doing data cleansing on 1million + rows is doing it in the same amount of time.
 

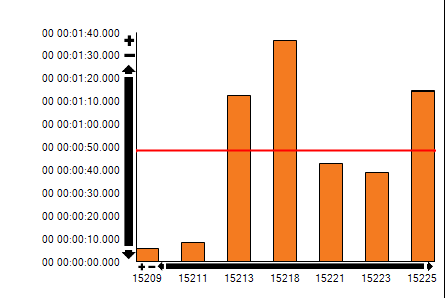
See this small table that is 400 rows, no transformations and only 10 columns.


I can see we are peaking log io at 100% during certain periods.

However, that seems to be during the later parts of the loads and not during odx transfer in the start.


Is there any thing that can cause this or possibility to improve it?

Thank you,
Victor​​​​​

Best answer by rory.smith

Hi @Victor ,

how are your incremental loads set up? If you have delete handling or PK updates turned on your incremental loads will always pull the full primary key set from source which may be substantial. If that set has crossed some kind of tipping point it could explain increased slowness.

Are your sources database connections or CData? If they are CData, do you have logging turned on? This can substantially slow down ingestion.

It may be worth having a look at disc queues on your TimeXtender VM while you are ingesting, the ODX Server uses a SQLite database as a local cache and that may be part of your bottleneck.

It may be interesting to try and see if you can get logging from your source. That way you could monitor any latency between triggering an execute in TX and the source system being queried and subsequently the writing of parquet to ADLS. If there is lag, I would expect the SQLite DB or something else local to the VM to be the cause.

If your ODX → DWH is the main culprit, you could consider attempting a restore of a backup of your Hyperscale database to a new database and verifying whether that has a different performance profile. I have encountered (and am still trying to find RCA with Microsoft) that Hyperscale database performance can ‘degrade’ even though nothing seems wrong from an infrastructural perspective.


17 replies

Forum|alt.badge.img

I would also be intrested to know the reason behind this. 


Christian Hauggaard
Community Manager
Forum|alt.badge.img+5

Hi @Victor 

Please try to use SQL profiler in Azure Data Studio to identify which step is taking the longest time.

Also are you using incremental load? Can you please share screenshots of table settings?

Have you considered using simple mode for these tables without transformations in an attempt to improve performance?  

We have had some customers reporting performance issues with hyperscale recently, so it might be worth reaching out to somebody at Microsoft as well.


  • Author
  • Participant
  • March 15, 2024

Hello @Christian Hauggaard

We are running incremental load on as many tables as we can. The load example (an hourly load) therefore has a combination of fully loaded and incremental tables. 

We have simple mode on every table in the mdw + any DSA tables that are not having transformations. 

We made the switch from Premium DTU (1000)  to hyperscale two weeks ago to try and get a increase in performance, but it has stayed the same. We first tried an increase in dtu and then later increased vcores from 8=>12 =>16 without an improvement in odx tranfser (only data cleansing got better).

We are seeing an increase in ODX data transfers over the past months. Alot of smaller tables taking longer time to run odx execute on.

It reminds me of a situation a year back when our odx backlog file was corrupted which made every table take slightly longer time every load. However, we are not seeing the same error messages to indicate it’s the same problem.

Previously when we needed better performance we tweaked the database, however this is not improving the odx transfer.

DSA => MDW step is extremly quick and barely noticeable in the execution package.

The issues seems to lie in the data lake => dsa step.

Here is a table in the dsa with 3 rows and 3 columns I ran twice, that took 60s  to run execute on in the dsa while no other package was running.


Today while monitoring the loads, I saw the CPU usage on our vm machine running the ODX server sometimes spike to 90-100%.

I assume this bottleneck ado.net transfer?  However, most of the time it is running on sub 60% which was the case during the above example.


rory.smith
TimeXtender Xpert
Forum|alt.badge.img+8
  • TimeXtender Xpert
  • March 18, 2024

Hi,

there are quite a few things to look at here:

  • look at your database metrics at a fine time granularity: you are probably running into log i/o governor waits (100% log I/O). Make sure you choose the max-variant of the metrics and choose a fine enough time granularity so your peaks are not hidden
  • look at the query store in your database through SSMS and analyze your waits. If the log i/o governor is a fairly high share then you are bottle-necked by that. The only way to get faster log i/o is by running IaaS or changing the amount of data or ordering of load.
  • look at the most expensive queries in your query store: if you are spooling to TempDB, that is slower on Hyperscale than on the non-Hyperscale databases
  • if you are using ADO.Net to transfer from ADLS to Azure SQL DB Hyperscale, you may be limited by the memory on your TimeXtender application server. The parquet files need to be transferred to the VM and decompressed there before being sent to the Hyperscale DB.There is a setting to limit the memory, if you are not running out of memory you can increase this. If you are running out of CPU you can of course add more cores to the VM. If you are running a VM in the D-series, consider scaling it to an E-series for more RAM per core
  • You can consider using ADF with an Azure runtime or self-hosted integration runtime on a dedicated VM (or cluster) to make this transfer (potentially) faster. This has some settings you will need to tweak to ensure fast flows
  • If your ODX is refreshing data, any DSA transfer will wait for that refresh to finish. This is shown as Data Movement time and not separately visible
  • If your ODX Data Source runs out of parallel connections (DSA transfers count), your DSA transfer will be pending and waiting in the queue. This shows up as Data Movement time and is not separately visible
  • I have not seen much benefit from the premium memory-optimized compared to regular premium hardware, but that will depend strongly on the specific cleansing you are doing. Adding cores does not increase log i/o that is 100 mb/s for all scalings, premium hardware simply ensures you always get gen8 CPU instead of something from gen5 to gen8
  • There have been some issues with Hyperscale resources about a month ago, but those are resolved now as far as I am aware

  • Author
  • Participant
  • March 22, 2024

Hello Rory,

Thank you for your feedback.

I have looked into each point before but I went through them again today running tests.

I have been keeping track of the log io and while we reach 100% at later stages (understandable due to data size) it is not during the time where we run alot of small tables where we have a MAX log io of 40%, nor during my testing when schedulings är turned off.

CPU or Memory on the VM machine doing ado.net never went about 30%.

We do not have any sources running ODX, syncs, transfers or any other tasks during scheduled loads or during my testing.

But the question remain the same. 

Why is a 3 row table taking 60s-120s for Timextender to transfer from the odx data lake to a sql database? The ODX transfer tasks takes 1s in comparison. 

This table is not running during expensive queries during any of my testing.


The log/io, cpu usage and any other metric on the sql database is below 20% during all testing on the above table. The vm machine is running at 20-30% cpu and memory. No ODX tasks are running that should be affecting it.

Please note I took a small table as an example, but this is affecting alot of other “small” tables aswell.

I can find no metrics that can explain this bottleneck nor can I find any way to improve it.


rory.smith
TimeXtender Xpert
Forum|alt.badge.img+8
  • TimeXtender Xpert
  • Answer
  • March 22, 2024

Hi @Victor ,

how are your incremental loads set up? If you have delete handling or PK updates turned on your incremental loads will always pull the full primary key set from source which may be substantial. If that set has crossed some kind of tipping point it could explain increased slowness.

Are your sources database connections or CData? If they are CData, do you have logging turned on? This can substantially slow down ingestion.

It may be worth having a look at disc queues on your TimeXtender VM while you are ingesting, the ODX Server uses a SQLite database as a local cache and that may be part of your bottleneck.

It may be interesting to try and see if you can get logging from your source. That way you could monitor any latency between triggering an execute in TX and the source system being queried and subsequently the writing of parquet to ADLS. If there is lag, I would expect the SQLite DB or something else local to the VM to be the cause.

If your ODX → DWH is the main culprit, you could consider attempting a restore of a backup of your Hyperscale database to a new database and verifying whether that has a different performance profile. I have encountered (and am still trying to find RCA with Microsoft) that Hyperscale database performance can ‘degrade’ even though nothing seems wrong from an infrastructural perspective.


Christian Hauggaard
Community Manager
Forum|alt.badge.img+5

@Victor do you have an update on Rory’s questions above? Were you able to restore a backup of your Hyperscale database to a new database?


  • Author
  • Participant
  • June 3, 2024

Hello,

@Christian Hauggaard, sorry for the late response.

During the past month we have finally had time to run further tests.

We tried several different setups and combinations on the same data sets running for several days.

1,We went over to business critical again and got the same result.

2,We restored aswell as went back to hyperscale and got the same result.

3.We tested several different VM machines and while we found one that resulted in a slightly better transfer compared to the others it was not noticeable enough.

I also had the opporunity to test the ODX with a data lake (as we had above) and the same ODX with a SQL database to compare the differences in another enviornment.

The performance between the two were very different and the results suprised me.With the ODX running on a SQL database having on average 3x fast transfer times with ODX transfer tasks (source => odx) and aswell as better odx => dsa performance.This was tested across multiple sources and data sizes.

While I do not have the technical knowledge to fully understand the infrastructure behind the solution at a depth, this testing leaves me to believe the culprit lies in the parquet and/or data lake structure as the difference between them was so big. 

Ignoring the cost difference for the moment, I would have a hard time recommending data lake over sql database for any solution requiring quicker loads and data based on the results we got.

Has anyone else tested this and seen different or similar results?

Thanks,
Victor


  • Contributor
  • January 22, 2026

@Victor Hi Victor,

I was wondering if you managed to solve this issue.

Sometimes there is a big lag in data lake → DSA transfer, but I also cannot fiind the reason (no memory or CPU or Database stress at any point).


Kind regards,

Pieter


  • Author
  • Participant
  • January 22, 2026

Hi ​@PieterQ 

We ended up doing even further testing, but the only solution we found was simply just using a sql database for the ODX instead of a data lake.

Our only worry ahead of time was how it would effect the overall cost but we actually ended up net neutral. This is because the extra money spent on the sql database for the ODX, we made up because we could lower the performance of the DSA database since the data lake => dsa was not a bottleneck anymore. 

Note this was done on two projects in 20.10. Not sure if this problem still exists or works for the new TDI, but I always recommend a sql database for the ODX now days.


  • Contributor
  • January 22, 2026

@Victor 

Ok, thanks so much for the info!


rory.smith
TimeXtender Xpert
Forum|alt.badge.img+8
  • TimeXtender Xpert
  • January 22, 2026

Hi,

I suspect one of the performance bottlenecks is that implicit data type conversion is quite expensive when moving from ADLS to SQL - I recently had a fairly large Excel file suddenly take forever to transfer to Prepare, changing the datatypes to match between Prepare and Ingest solved the issue. When this happens you don't see any activity on the VM or the target database. In my case the Prepare was set to nvarchar(4000) where the Ingest was actually nvarchar(30) or something like that.


  • Contributor
  • January 22, 2026

Hi ​@rory.smith ,

I am using a REST data source, and let TX decide what data type a col has (using the exhaustive neta data scan option) using the Metadata Manager.

Also, in ADLS2 data is stored as a parquet file, so writing to a SQL database always requires implicit conversion  I guess.

The columns and data types are described in the _METADATA_0000.json in the root of the ADLS2 folder where source data is stored.


So at what point is implicit conversion an issue, and how can you prevent it from happening?


rory.smith
TimeXtender Xpert
Forum|alt.badge.img+8
  • TimeXtender Xpert
  • January 22, 2026

Hi,

for parquet to SQL the types should match - so if the metadata manager states a field is a nvarchar(500), it should be exactly that in your SQL layer. The main thing is to be sure you are synching your Prepare with Ingest after any structure change, and you are not right-clicking fields and choosing a different type than the one flowing out of the mapping.


  • Contributor
  • January 22, 2026

@rory.smith 

I understand, thanks for the inpu!


Forum|alt.badge.img
  • Contributor
  • January 26, 2026

Hi,

We’ve had the exact same problem since we started using the new TimeXtender two years ago. Every ingest → prepare transfer will take at least around 60 seconds. Even a table with one column and one row. 

From testing the problem seems to be Ingest storage → Prepare table. And it’s not data transfer that takes time, but per-pipeline overhead from authentication, starting up services, etc. TimeXtender creates a pipeline for each table in the Execution package, it seems? So the real fix would then let TimeXtender run multiple tables in a single pipeline instead of creating many. Would that be possible?

We have the Ingest storage in Azure blob storage, and we use ADF. For Prepare we use Azure SQL Server.


rory.smith
TimeXtender Xpert
Forum|alt.badge.img+8
  • TimeXtender Xpert
  • January 26, 2026

If you use ADF and Azure runtimes you should set your TTL long enough that it doesn't spin up a new one for each pipeline - In Azure runtimes those take about a minute for the regular ones (on Microsoft's dime) for Managed VNET Injection those take about 45 seconds and you pay for the spin-up time. If you run self-hosted integration runtimes, you should see less lag.