
Hi support,

I am experiencing some strange behaviour when the Scheduler service wants to start execution packages. The following is happening:

the schedule is supposed to start at every full hour. I know that it can take up to 2 minutes for an execution to actually start. Until last monday 18:00 everything was fine. The packages started within 2 minutes and were finished within 10 minutes. 

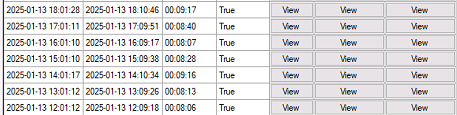
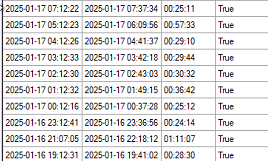
After last monday 18:00, we are experiencing a delay in the start. Almost anytime the packages starts, it takes a 12 minutes delay. 

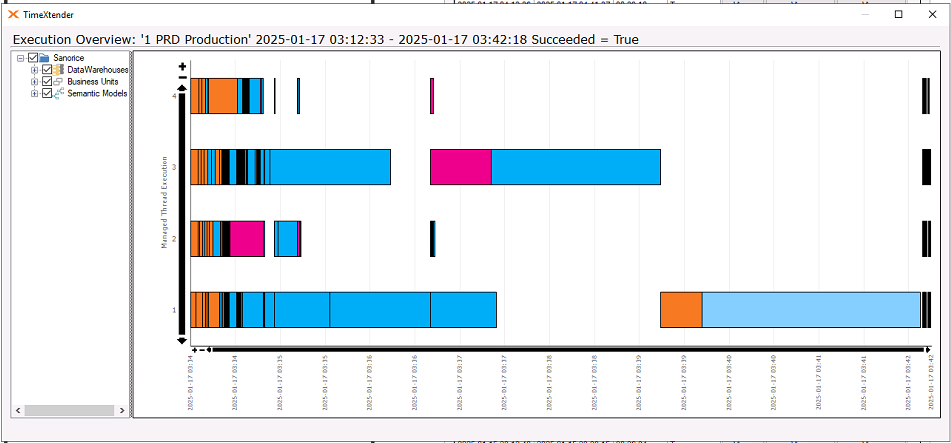
It also looks like the execution takes way longer than 10 minutes. However, when I look at the gantt chart, I see it still takes up to about 10 minutes to finish. According to the screenshot below it was supposed to start at 03:00, it actually started at 03:12 but if you look closely at the actual times in the gantt chart it only started at 03:34 to finish at 03:42, which is still only 8 minutes. 
 

It is TX v20.10.39.64. The database is Azure SQL, sometimes we use 100% CPU but given the reloadtimes are not affected we do not think this is the cause. The Azure Portal tells us we are allocating 445 GB of the reserved 600 GB. 
 

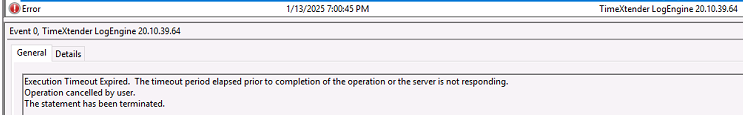
When looking in the Event Viewer we find an error at last monday, 13 january, at 19:00. The time we first see the behavior happening. I have rebooted the application server but that doesn't seem to solve it.


I hope you guys can point me to a (possible) solution. 

Best, 

Remy

Hi,

what is the load on your repository database? It may be that that is taking a long time to respond.


Hi ​@Remy Kamphuis | Victa do you have an update on Rory’s question above? Also can you please check if there are any other execution packages running during this time period, perhaps the execution package was waiting on another package to finish?


Hi ​@rory.smith and ​@Christian Hauggaard,

I wanted to ask this specific question to Support so I forgot I had also asked the question on the community. Thanks for your answers.

The main thing is that it takes several minutes to open the project. I have made a copy of the repository database and changed to repo in the project to this copy. Unfortunately, this has not solved our problem. 

We also have a Development environment, where we have over 4800 versions on a server that has less capabilities than the production server. The project in production has only 850 versions. The only difference here is the amount of executions, because on production we have hourly executions as well as executions running every 4 hours. On development everything runs only once a day, except for the manual executions while developing logic. 

Have had contact with Thomas but we haven't been able to find a solution yet. If you have any ideas or experience with this kind of behavior, please let me know. :)


Hi,


normally development environments have many project versions and less execution logging compared to production environments with less versions and more execution logging. If your repository databases are Azure SQL DB as well, what scalings are you giving them? You can check the metrics of your repo databases to see if you are coming close to the limits. I would also analyze wait statistics in SSMS for your repository databases if the metrics do not allow conclusions to be drawn.


Hi ​@Remy Kamphuis | Victa did you have a chance to check the scalings and metrics as suggested by Rory above?


Hi ​@Christian Hauggaard 

Yes, we do not host the environment but we were finally granted access to see the metrics in Azure. We indeed had reached the maximum DTU, it was both max and average almost continuously on 100%. We upgraded the environment from S1 to S2 but even though the DTU wasn't 100%, TX was still slow. I then deleted a bunch of execution logs from years ago and used the copy of the repository as well as an upgrade to S3 of the Azure db and now everything is running smooth again.

@rory.smith thanks for your help. 


Reply