

You can keep track of what the Ingest Instance Server is doing and has done in a number of ways.
Contents
View Executing and Queued Tasks
In the Execution Queue, you can see the tasks that are currently executing, waiting to start or just finished executing.
To open the Execution Queue,
- Be sure the Ingest Instance is selected and in the Tools menu, click Ingest Instance Execution Queue.
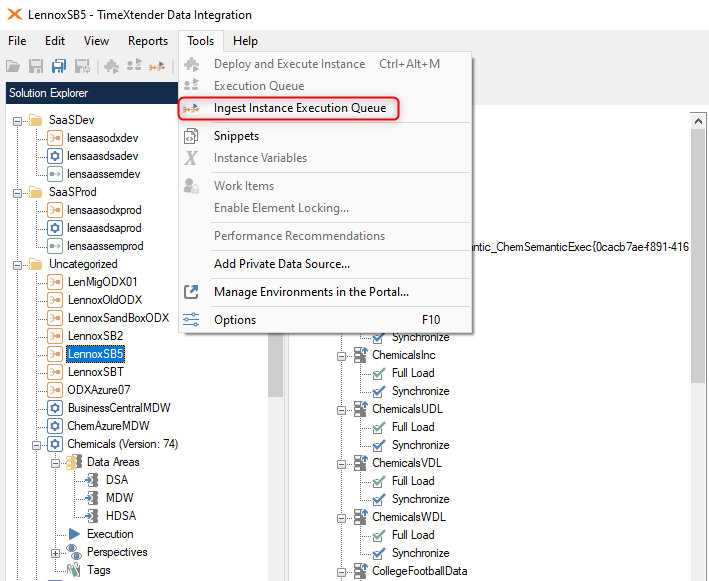
- The Ingest Instance Execution Queue menu can be opened whenever this icon is available.

The Ingest Instance Execution Queue shows currently running, pending tasks and recently completed tasks.

You have the following options.
- You can click on Refresh or press F5, to see updated tasks.
- You can click on Stop, If you click on a running task, a Stop button will appear, that can be used to stop a task execution
- You can click on Remove to remove a pending or completed task.
View Previously Executed Tasks
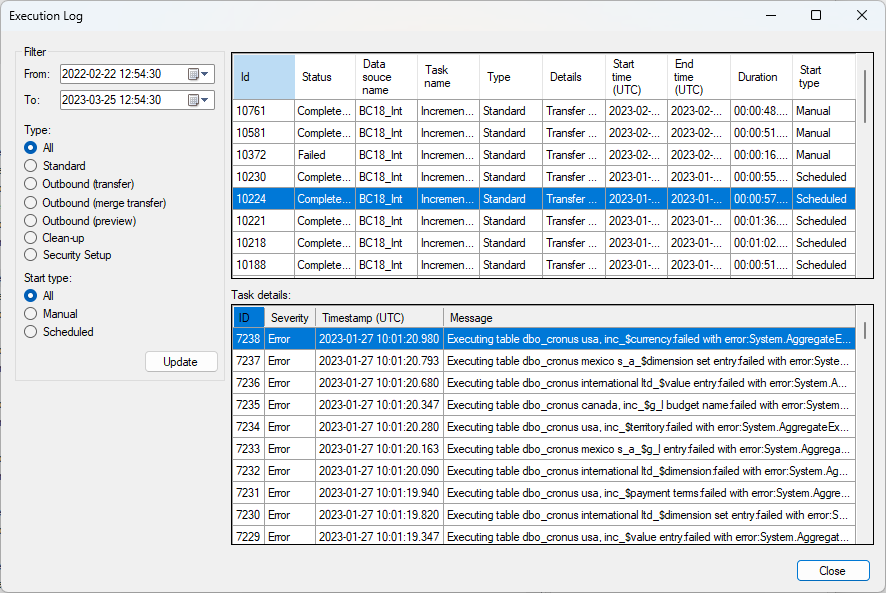
The Execution Log shows you all the previous task executions.
There are two ways to open the Execution Log
Main Execution Log
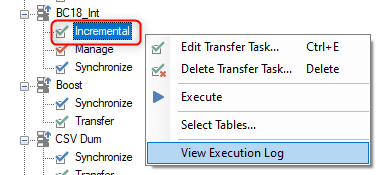
- On the Ingest Instance, right-click and choose View Execution Log.
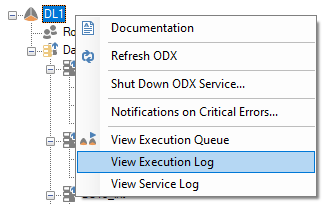
- On the ingest instance, right-click and choose View Execution Log.
The main Execution Log shows all executed tasks across data sources and the external transfers to prepare instances.
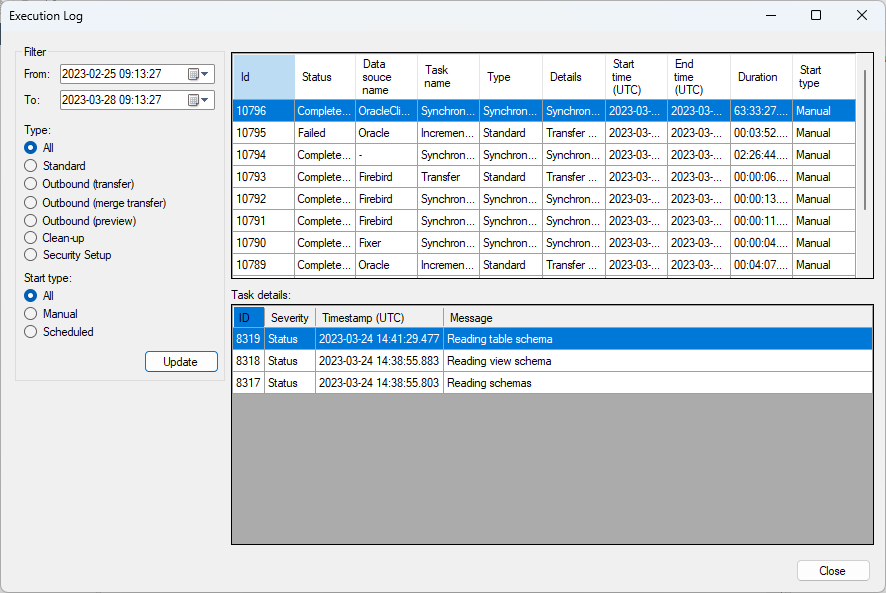
- Time span (From and To dates and time)
- Type of task
- All: All the rows in the given timespan
- Standard: Is all transfer execution tasks
- Outbound (transfer): Is tasks transferring from Ingest → Prepare.
- Outbound (merge transfer): Is tasks using the ADF merge threads option for transferring from Ingest→ Prepare.
- Outbound (preview): Is when someone is previewing a table in the table select menu.
- Clean-Up: Is a type that allows you to see clean up tasks.
- Security Setup: Is the tasks that adds security to a data source.
- Start type
- All: Is all the tasks
- Manual: Is the manually started tasks.
- Scheduled: Is the scheduled tasks.
You can see the full message for an item in the Task details list by double-clicking on the item.
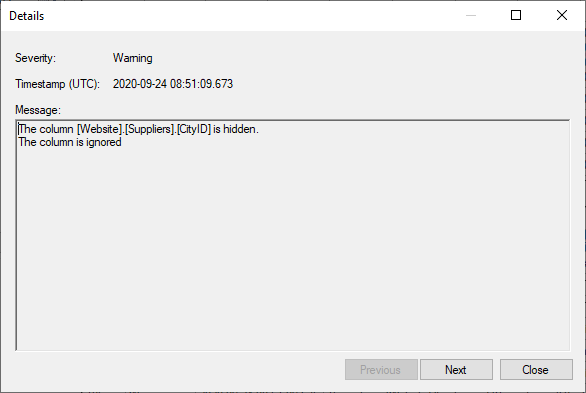
Click Previous or Next to navigate to other messages in the selected execution.
Specific Execution Log
You can also open the Execution Log on a specific task of a data source, to see how previous and current execution are doing.
To open a specific data source task execution log.
- Right-click on a task and choose View Execution Log.
The content of this log is specific to this task only
Other than that the options are the same as the one you have on the main instance.
View Log of Service Calls
The Ingest Instance Server also logs the communication between the Ingest Instance Server Manager and itself.
To open the Service Log
- Right-click on the Ingest Instance and select View Service Log.
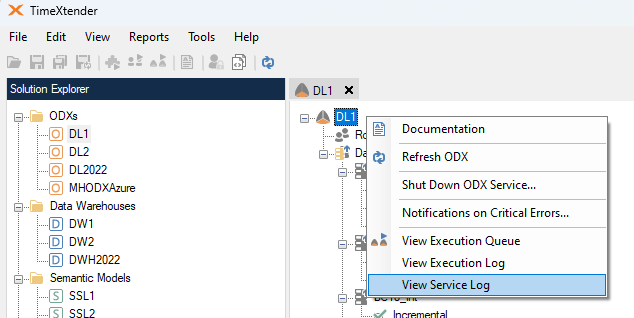
It looks like this
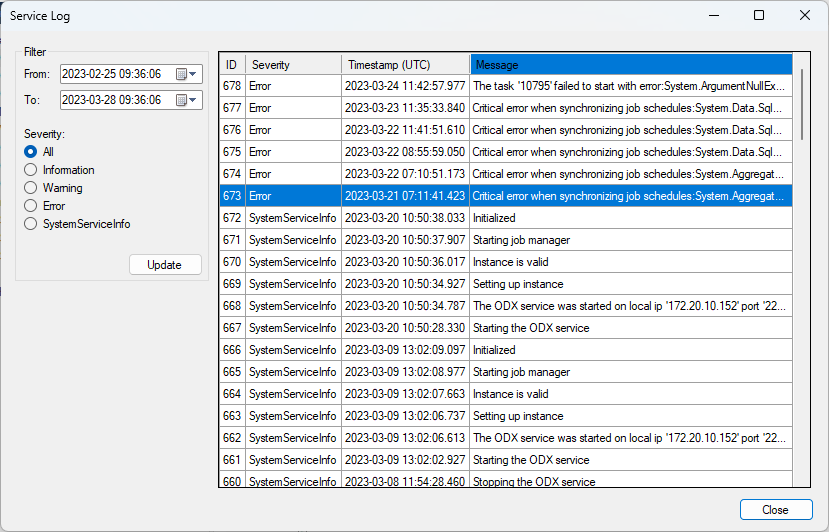
You can see all log entries sent about the service. You also have some options to filter the entries.
- Filter. Is a timespan option to choose a from and to date to get the entries.
- Severity
- All: Is all entries in the added timespan filter.
- Information: Is specific Information entries
- Warning: Is not error entries but warnings about possible issues.
- Error: Is errors received from the Ingest Instance Service.
- SystemServiceInfo: Are information about tasks being performed by the Ingest Instance Service.
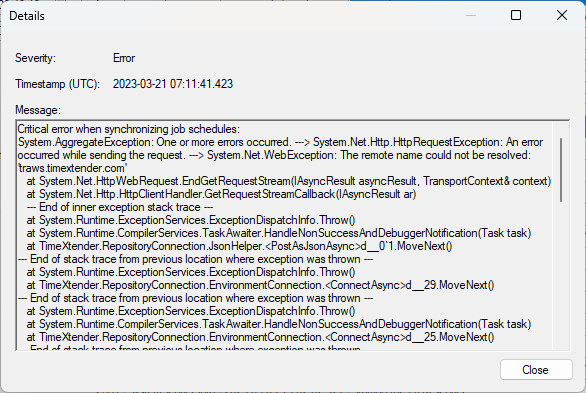
You can get additional information about an entry by double clicking on the message.
View Data Source and Data Storage Statistics
The TIS server collects some statistics on the data source and data storage. On the data source, you can see e.g. how many tables and columns are available. On the data storage the number of tables and columns and the total data consumption is listed.
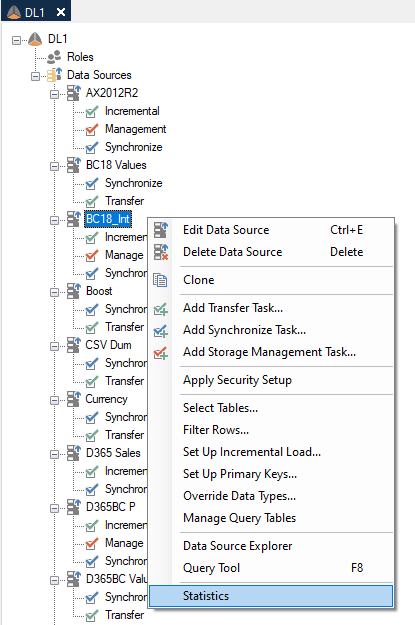
To view the statistics of a data source.
- Right click a data source and click Statistics
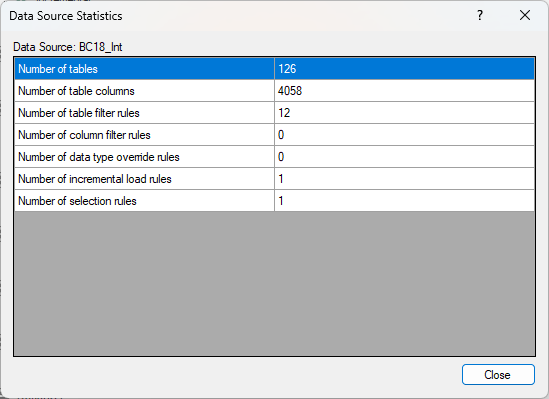
It will give information looking like this.
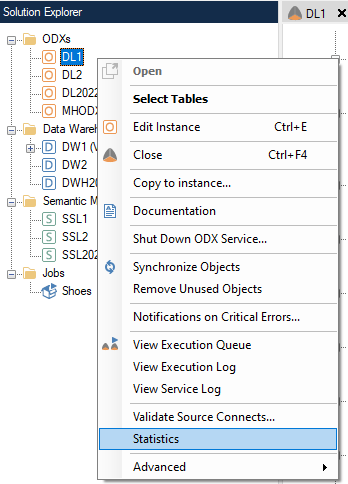
For the entire Ingest Instance you can also see it. You open it like so.
- Right-click on an open instance and click Statistics
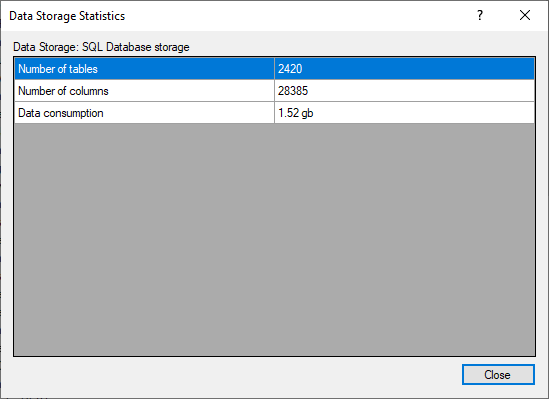
The data storage statistics will depend on whether the ingest instance storage is set to use an SQL Server database or an Azure Data Lake Gen2 container.
SQL Database Storage
When the storage is to use an SQL Database, the following three data storage statistics will be displayed.
- Number of tables - count of tables within the database.
- Number of columns - count of columns across all tables in the database.
- Data consumption - the size of the data stored, typically displayed in gigabytes or megabytes.
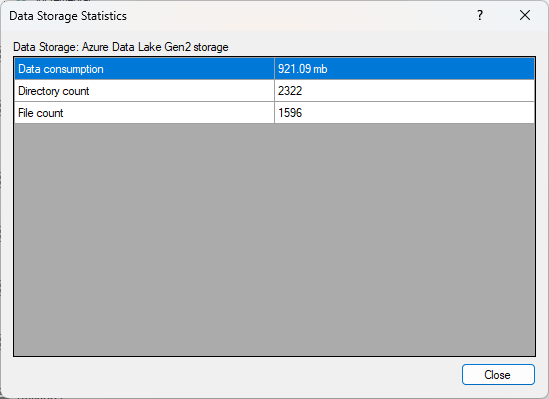
Azure Data Lake Gen2 Storage
When the storage is to use an Azure Data Lake Gen2 container, the following three data storage statistics will be displayed.
- Data consumption - the size of the data stored, typically displayed in gigabytes or megabytes.
- Directory count - the total number of directories present in the storage container.
- File count - the total number of files stored within the storage container.