ADO.net mechanics

  • 12 June 2023
  • 8 replies
  • 146 views

Badge

Hi all,

We’re trying to troubleshoot some thorny networking issues, and I need to know more about how ADO.net data transfer works behind the scenes - specifically for old-school business unit SQL Server data sources, if that makes a difference. 

I know for sure is that data is read from the data source and written into the destination table in the staging database, but I’m fuzzier on what happens between the two places. To start off with, I have two key questions: 

We’re using a tool server to run TimeXtender, and a different server to host SQL Server and the TimeXtender databases. Is data routed through the that tool server when it is read via the ADO.net package? I assume that it is, but we need to know for sure. 

The other question I have is what happens after the data is pulled from the data source? Is it pulled into memory somewhere? If so, where? The source server, the tool server, the destination data server, or some combination of the three? Is the data ever written to disk anywhere before it is written into the destination table? Or does it skip memory/disk altogether via some continues flow of data between the source and destination? 

Based on the fact that TimeXtender appears to first do a SELECT in the source, then an INSERT on the destination, I’m guessing the data is cached in memory in at least one place, probably the tool server, then written to the destination table. But again, we need to be sure in order to understand the issue we’re having, and to be sure that we’re providing enough memory (and/or disk space) for the application to run our execution packages smoothly. 

Thanks in advance for your help!


8 replies

Userlevel 6
Badge +7

Hi @ekw9 ,

as far as I am aware the BU approach using TimeXtender's SQL Server source will run through the Application Server (or Tool Server as you call it). The only way to bypass that is to use ADF-enabled source connectors and the ODX Server.

I expect data is buffered in memory only (up to the point where virtual memory comes into play), but I would expect TimeXtender is using some standard library. If you are using CData connectors, those definitely load new data to memory though you also have the option of using disc cache.

Perhaps it is useful to give some details on the issue you are facing?

Badge

Hi Rory,

We’re trying to troubleshoot an issue where TimeXtender passes through an “timeout or disconnect” error from SQL Server that doesn’t match any of the timeouts configured for the connection, either for the BU or for the data source itself. 

Routing through the tool server is fine, but we need to know the path so we can figure out where an issue might possibly be occurring. Also, if the data is buffered in memory, we need to know where to ensure that there is enough space. TimeXtender is supposed to be a lightweight app, but if it’s pulling a huge amount of data into memory, then we need to ensure that the application server has enough RAM to handle that. 

Our DBA’s current theory is that the issue is actually with the application server. She suspects that if TimeXtender is caching data that it pulls from the data source, then it might run out of memory and stop responding to SQL Server. When that happens, SQL Server responds by closing the connection. As a result, it’s TimeXtender/the application server that “times out,” not SQL Server itself. 

I don’t know enough about how ADO.net transfer works to say whether this is a possibility, but I do not have the necessary access to troubleshoot the issue personally. As a result, we need to rule this theory out before we can move on to other options. 

Userlevel 6
Badge +7

Hi @ekw9 ,


I would monitor the resources on the application server: the memory used by TimeXtender (either as user or when a scheduled execution takes place) depends on the size of your project. I quite commonly see 4-5GB used for larger projects.

Given that the pipeline is source → Application Server → target DB , there are (at least) two network connections involved that may experience issues. 

Do you have Enable Batch Data Cleansing set on the table settings of the larger tables in your BU for the source that is causing issues? Usually somewhere between 200K - 500K seems optimal. This will batch the transfer and should show you regular chunks of data being pushed to the target DB.

Userlevel 6
Badge +5

Hi @ekw9 

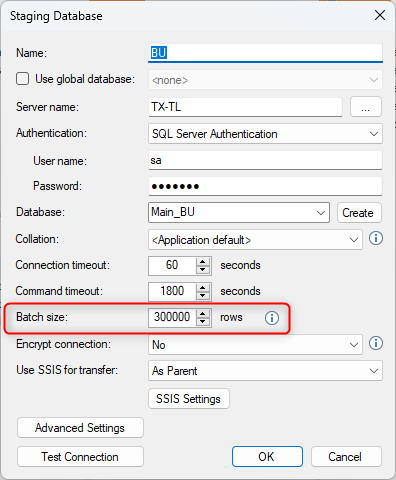
Rory’s suggestions are what I would suggest as well. Since you specify that it is a BU setup, I can show the following image.

By default the staging database is set to batch all transfers to 300000 rows in memory. The default for a DWH database is 0 which is indefinite.

If you at the same time uses the Batch Data Cleansing as mentioned above, it is the best way to limit the amount of memory used on the “tool” server.

On the SQL server the main usage, if I remember correctly, seems to be the CPU usage.

Badge

Hi Thomas and Rory, 

Thank you for these suggestions! Luckily, we have already implemented batch data transfer and cleansing where possible. 

As for SQL Server resource pain points, in my experience they usually go usually go 1) disk I/O, 2) RAM, and 3) CPU, although I’m guessing that could change if you were using a lot of index compression and hashing a lot of data. 

We do also realize that there are two possible places where the connection could fail (data source → app server, app server → ODX) and we’re looking carefully at both. 

An update to this: we managed to run down someone from our our infrastructure team internally and they determined that server resource exhaustion does not seem to be an issue. I suppose it could be an internal TimeXtender problem, though TimeXtender memory issues are usually accompanied by a crash and a KERNELBASE.dll Event Viewer error, not the TimeXtender error we saw. 

I am still curious where (if anywhere) data from an ADO.net transfer is cached in memory or on disk. Is this knowable? It might still help us in the troubleshooting process. 

Best regards,

Emily Wynkoop 

Userlevel 6
Badge +7

Hi @ekw9 ,

it might be useful to also monitor wait times on your source and target db to be able to rule out other processes being in the way. I have on rare occasions experienced the situation where we were waiting on “something” that did not seem to consume any resources, but this usually turned out to be database-related. I know that there are some issues (still) in SQL Server 2012-2019 (sampled statistics)  and 2022 (descending indexes) that can cause poor performance, but that should be across the board and not transient.
If you are running in on-prem infrastructure you may also be experiencing temporary networking congestion / routing issues. In Azure this should not be the case. In theory just having task monitor open while you are transferring should show you network receive and send bandwidth spikes when a request is done from source and piped onto target. Given that you have batching set up, there should be no accumulation of data that exhausts your resources.

As to what is consumed from ADO.NET: that would depend on the actual calls being done in code, there is documentation on some of the internal workings but this will probably also depend on the actual drivers / libraries and their versions running on your hardware.

How large is your project when you export it to xml?

Badge

Hi Rory,

To clarify, I’m looking specifically for if, how, and where data is cached in transit by TimeXtender’s ADO.net packages. I’m sure that the TimeXtender development team knows the answer for this, and I was hoping to hear from them on it. I’d prefer not to guess or intuit the answer looking from the outside in, as that could easily send my troubleshooting efforts in the wrong direction.

While I doubt that ADO.net caching is the cause of the specific problem we’re facing, it would still be a helpful data point when understanding this (and other) transfer-related issues. 

To your points:

We are monitoring server performance on all of our SQL Server instances; to the best of my knowledge, we did not see anything particularly unusual at the time of the failure. Again, the errors did not occur after the same duration, nor did they occur anywhere near our configured timeouts for either the data source or the staging database. I’m not sure why degraded server performance would force a disconnect or cause timeouts to misbehave, but I’m always willing to learn. At the very least, we can rule out deadlocks as being the cause as those are carefully monitored. 

Networking is, of course, and always a potential cause in something like this. In fact, it’s my leading theory at the moment. However, as you point out, without some kind of special monitoring job in place, the necessary data to positively identify the issue probably doesn’t exist. Unfortunately, this problem is very sporadic, so getting the network team to constantly log traffic until the issue reoccurs is something they’re probably not going to do until we rule out all other possibilities. 

This project is the largest I’ve worked on since being hired on by TimeXtender back in 2014, but the size of export file is misleading. We’ve had to cram in a bunch of custom scripts to handle an extremely unusual data source that TimeXtender’s native functionality struggles with, which has caused the size of the project (in megabytes) to balloon far beyond what it would be if we were using only TimeXtender functionality.

However, the project is large enough that the UI has developed some lag, which is unfortunate. Due to the of the size of the project and the data set we work with, we do occasionally encounter unusual edge cases that don’t seem to affect other implementations. 

Userlevel 6
Badge +7

Hi,

for the ADO details I would explicitly tag @Thomas Lind and @Christian Hauggaard (or open a ticket). I am also interested in these details, as I tend to run into more exotic issues.

Couple of points:

  • transient errors would (to me) point to networking, as long as you know the query plans involved are fairly stable and the SQL Server instances aren't overtaxed or showing abnormal wait times
  • wait stats can be important because they can explain why the SQL Server side may be closing the connection. I don't know your infrastructure, but TimeXtender may not be the only user of the SQL Instances and other processes may be exhausting SQL Servers potential for a timely response. SQL Server itself is also not flawless, and especially in PaaS contexts you are expected to have retry mechanisms in place as there is usually only a soft guarantee that a task gets successfully run
  • The size of the project matters because various other resources can run out: case in point, you experience UI lag. I have had projects go over the maximum amount of graphical object handles Windows allows a process to have leading to issues. If your project has a lot of nested Execution Packages and excluded steps, you may find long times of nothing between packages because TimeXtender takes time to determine what to run.
  • Is the source that requires custom script also the one experiencing issues?

Reply