Solved

ADO.NET Transfer consistently slow on incremental table with no new rows


Badge

Hi! 

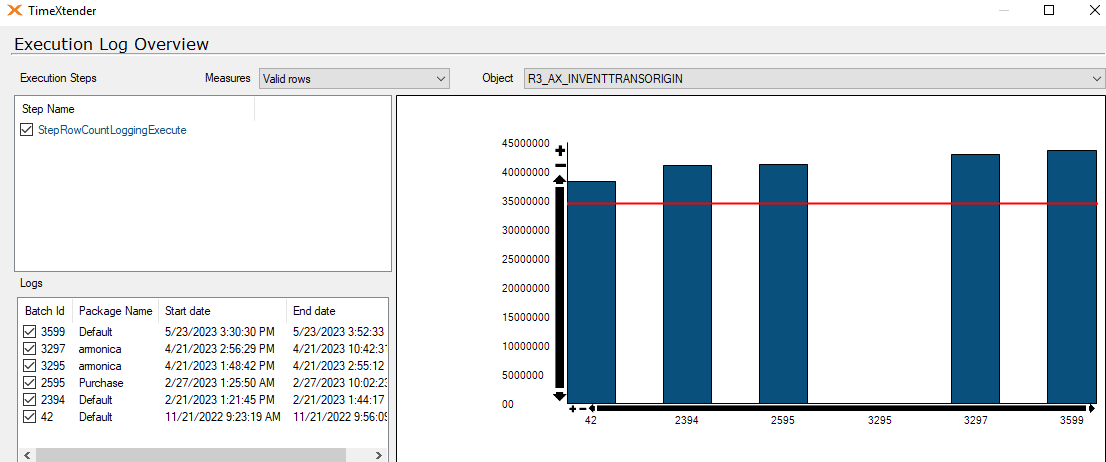
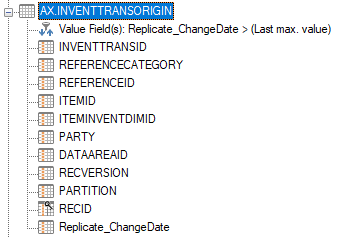
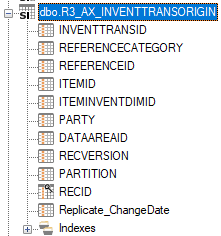
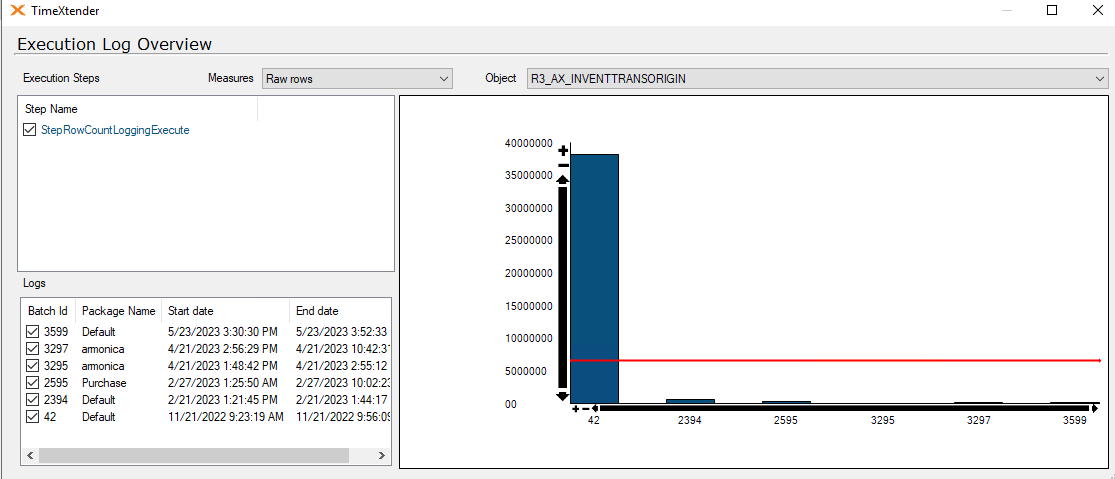
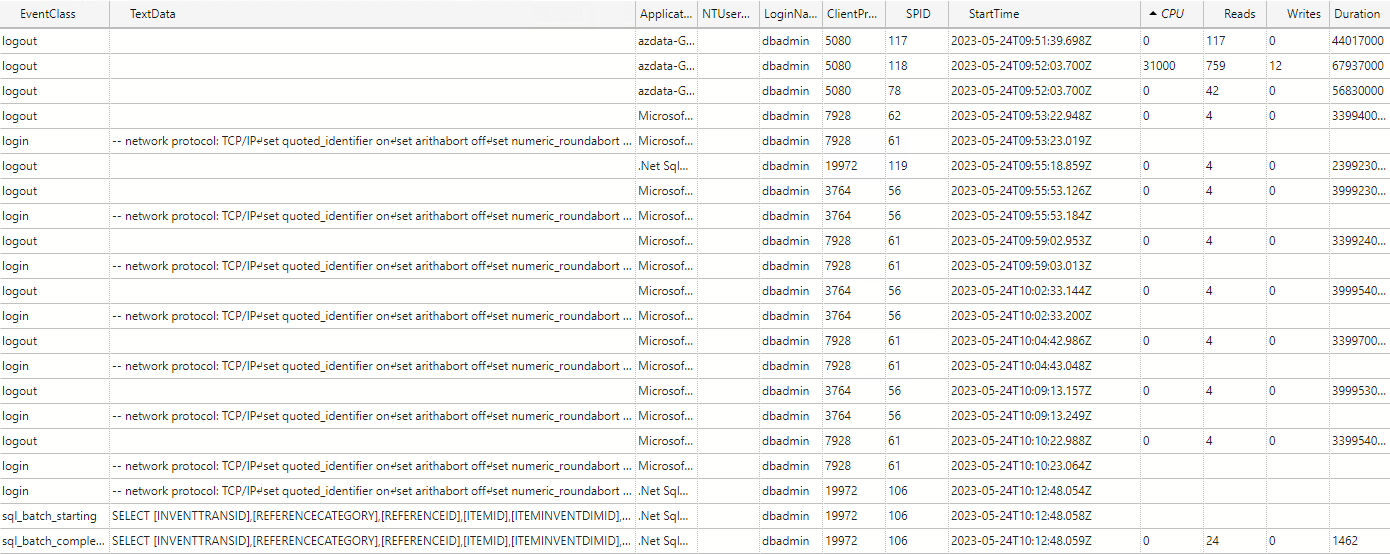
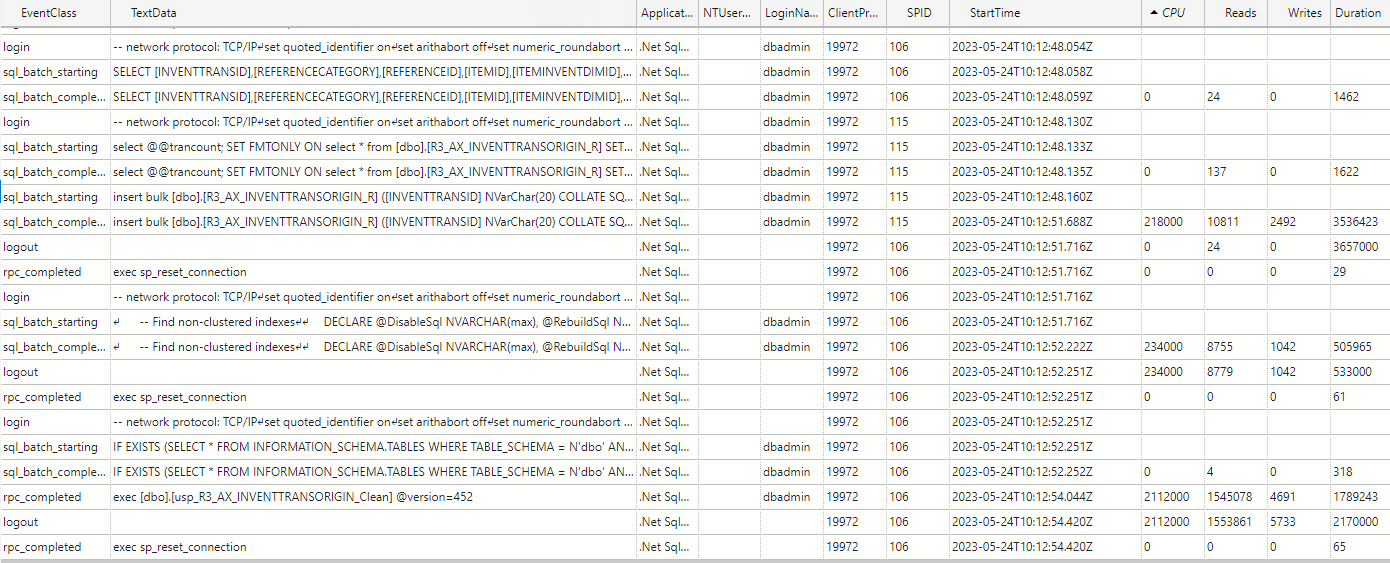
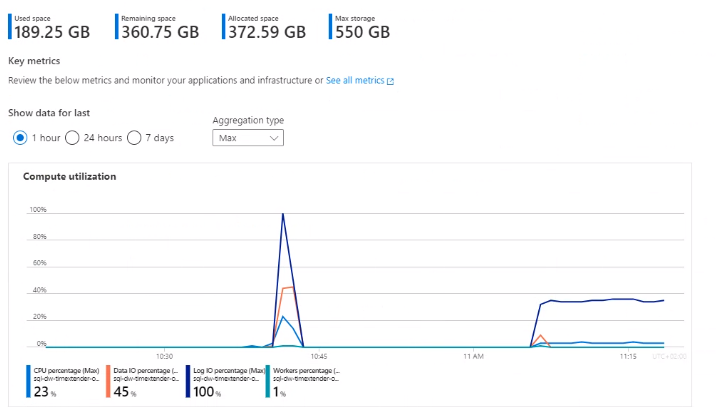
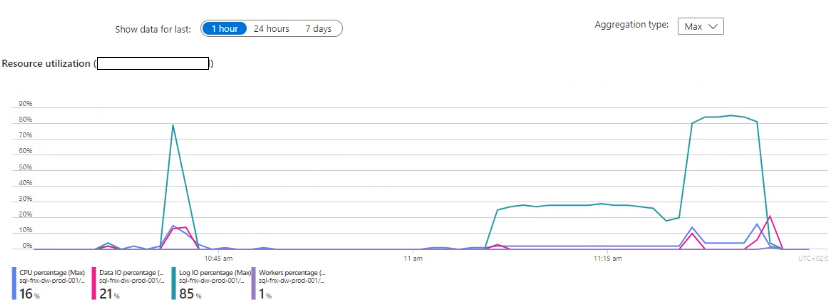
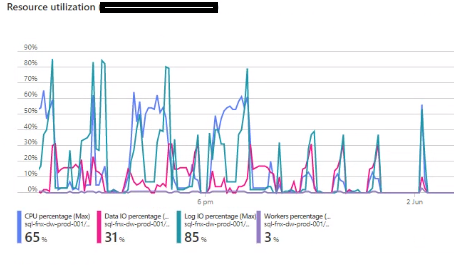
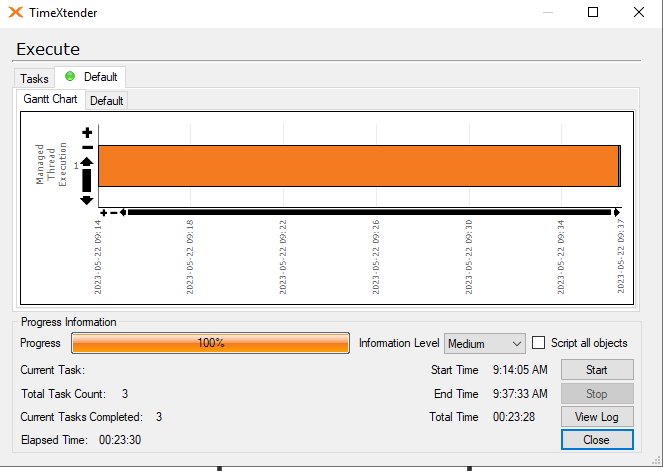
I am experiencing an issue with ADO.NET transfer times on incrementally loaded tables where the ADO.NET transfer takes the same amount of time regardless of the amount of new rows coming into the table. A full load of the table containing about 45 million rows takes about 25 minutes, on the next incremental load the load time is still the same with ADO.NET taking up around 24 of these minutes. 

Our current data flow is as follows: 

SQL server → TimeXtender → Azure elastic pool (this is where all of our TimeXtender databases resides) 


Full load - 45 million rows


Incremental load - 11 thousand new rows in the _R table 


The amount of new rows coming in to the table


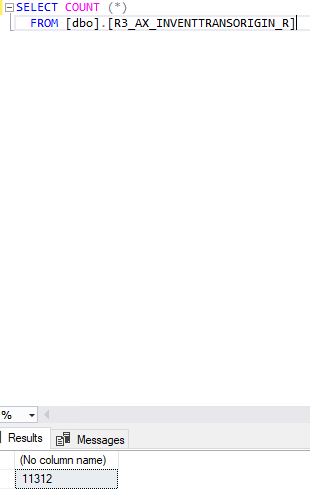
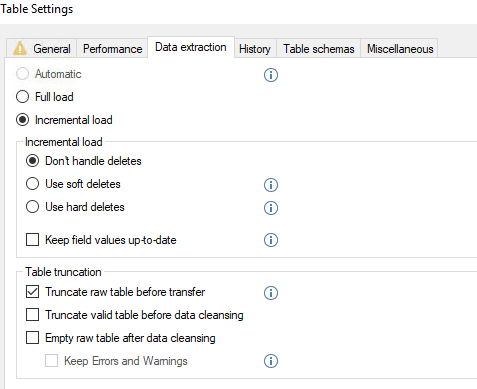
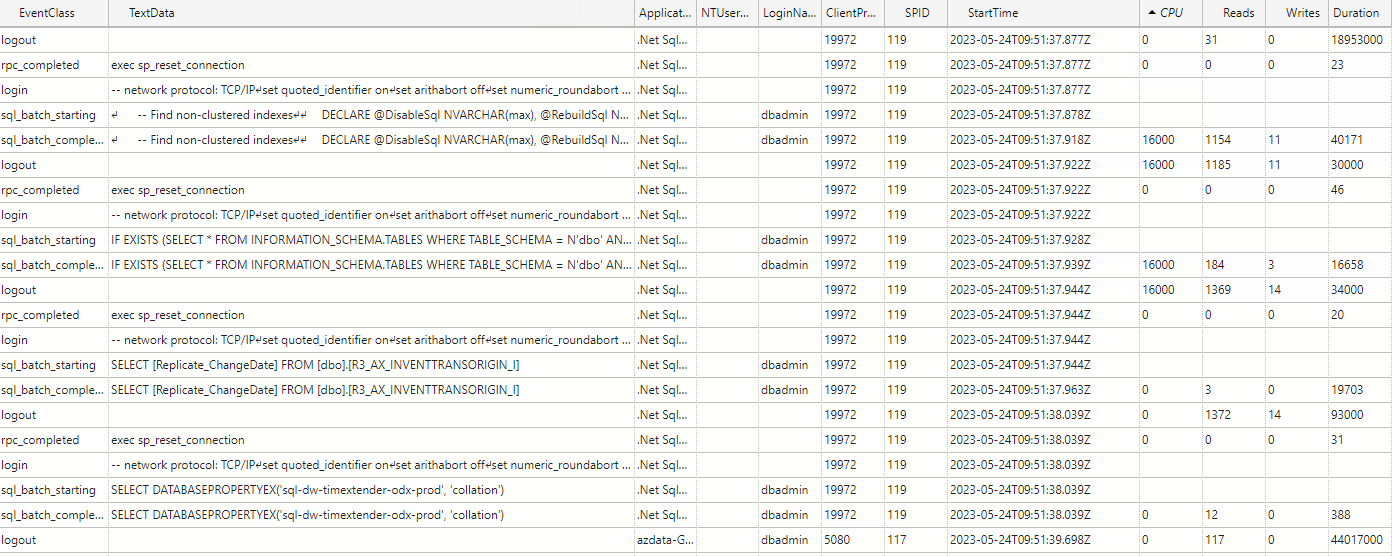
Has anyone experienced a similar issue? My best guess is that the problem resides in the azure elastic pool where the ado.net transfer is being throttled. Even if I have 0 rows in the _R table the ADO.NET transfer time is the same.


Thank you! 

icon

Best answer by Christian Hauggaard 1 June 2023, 08:46

View original

18 replies

Userlevel 6
Badge +5

Hi @william.sprangers 

How many raw and valid rows gets added in each execution?

You can see this in the View Execution Overview Log menu.

Userlevel 2
Badge +1

@william.sprangers do you have delete detection enabled?

Badge

Hi @william.sprangers 

How many raw and valid rows gets added in each execution?

You can see this in the View Execution Overview Log menu.

Hi Thomas, this is the amount of raw rows getting added in the last couple of executions 
 

Raw rows

And this is the amount of valid rows 


Valid Rows


Badge

@william.sprangers do you have delete detection enabled?

We currently don’t handle deletes on this table, these are our table settings for data extraction 


Userlevel 2
Badge +1

@william.sprangers i can see an exclamation mark on the General tab in your table settings, can you show me why it's there?

Badge

@william.sprangers i can see an exclamation mark on the General tab in your table settings, can you show me why it's there?

This seems to be related to simple mode being enabled on this table, so the table in question is a simple mode table being loaded incrementally 


Userlevel 6
Badge +5

Can you please share a screenshot of your incremental selection rule? What are the mappings for the table? Is it from an ODX data source? Is incremental load enabled on the data source?

Badge

Can you please share a screenshot of your incremental selection rule? What are the mappings for the table? Is it from an ODX data source? Is incremental load enabled on the data source?

This is the incremental rule on the table in the ODX. The TimeXtender version is 20.10.30.64 so we use a business unit ODX 


Incremental rule on the data source in the business unit

And then on the ODX the table itself looks like this 
 

ODX table

 The data source itself is an SQL server data source 

Userlevel 6
Badge +5

 @william.sprangers  thanks for confirming. What do the performance metrics look like on the Azure SQL DB, does there seem to be any bottlenecks? (i.e. CPU percentage / Log IO percentage)

How many rows are in Batch ID 3599 in the diagram below? you should be able to see the number of records by hovering over the bar

Can you please launch a profiler session in Azure Data Studio for the Business Unit Azure SQL DB and then execute the table again in order to identify the steps with the longest duration?

Userlevel 6
Badge +5

Hi @william.sprangers

It does look like it is adding only the new rows like it should. Apparently it takes as long as if it added all the rows every time.

How is the database set up? You mentioned it was an elastic pool something, so is it set like with serverless setup and will increase decrease in speed depending on what is being requested?

My idea is that it takes this long because it is taking time increasing the speed of the database before doing the transfer.

It could probably be tested for if you ran another table with a similar amount of rows first and then this table right after. It should then be up to speed and would be as fast as necessary.

Badge

 @william.sprangers  thanks for confirming. What do the performance metrics look like on the Azure SQL DB, does there seem to be any bottlenecks? (i.e. CPU percentage / Log IO percentage)

How many rows are in Batch ID 3599 in the diagram below? you should be able to see the number of records by hovering over the bar

Can you please launch a profiler session in Azure Data Studio for the Business Unit Azure SQL DB and then execute the table again in order to identify the steps with the longest duration?

I ran a server profiler using azure data studio on this issue and it looks like the sql_batch job gets started looking for the incremental date then nothing happens for 20 minutes and then the sql_batch job finished doing the select statement. So essentially from when the job started at 11:50 the only thing that happens is a couple of network protocols being run then the select finishes at 12:10 


Job gets started at 09.51 

In the first picture the select statement on the _I table is being run correctly 


Gap of about 20 minutes

Then nothing really happens on the ODX for 20 minutes 


At 10:10 the SELECT and INSERT statements start

Then at 10:10 all of the data is being sent in to the table. 


If I’m not reading this information incorrectly it seems that there is a freeze during this time?

Badge

Hi @william.sprangers

It does look like it is adding only the new rows like it should. Apparently it takes as long as if it added all the rows every time.

How is the database set up? You mentioned it was an elastic pool something, so is it set like with serverless setup and will increase decrease in speed depending on what is being requested?

My idea is that it takes this long because it is taking time increasing the speed of the database before doing the transfer.

It could probably be tested for if you ran another table with a similar amount of rows first and then this table right after. It should then be up to speed and would be as fast as necessary.


The elastic pool setup is such that each database being run gets a set number of vcores available (in this case it’s 12 vcores available per database) and then the elastic pool allocates resources as needed to databases. I tried running a different table before the current table (Inventtransorigin) but still seem to get the same problem unfortunately. I’m unsure if the elastic pool has some sort of spin up time but since this seems to be happening every time I execute the table I don’t think so.  

Userlevel 6
Badge +5

Hi William

OK, I see. It seems like it is either waiting to do something or actually transferring the data before discarding it.

This is the only table that behaves like this from this data source?
Can you share the Query it generates from the SQL profiler when transferring this table.

How long ago is it since you ran a full load?
Does it take 20-25 minutes to run a full load if you run it now compared to the one shown in the image?

Badge

Hi William

OK, I see. It seems like it is either waiting to do something or actually transferring the data before discarding it.

This is the only table that behaves like this from this data source?
Can you share the Query it generates from the SQL profiler when transferring this table.

How long ago is it since you ran a full load?
Does it take 20-25 minutes to run a full load if you run it now compared to the one shown in the image?

I seem to have the same issue for multiple tables from the data source, it looks like any table over 10+ million rows has this issue 

This is the query that I found in the profiler, it’s split up on different batches so I’ll mark each batch:

-- Batch 1 --

SELECT [INVENTTRANSID],[REFERENCECATEGORY],[REFERENCEID],[ITEMID],[ITEMINVENTDIMID],[PARTY],[DATAAREAID],[RECVERSION],[PARTITION],[RECID],[Replicate_ChangeDate],[DW_SourceCode] FROM [dbo].[R3_AX_INVENTTRANSORIGIN_R] WHERE 1 = 0


-- Batch 2 --

select @@trancount; SET FMTONLY ON select * from [dbo].[R3_AX_INVENTTRANSORIGIN_R] SET FMTONLY OFF exec ..sp_tablecollations_100 N'[dbo].[R3_AX_INVENTTRANSORIGIN_R]'


-- Batch 3 --

insert bulk [dbo].[R3_AX_INVENTTRANSORIGIN_R] ([INVENTTRANSID] NVarChar(20) COLLATE SQL_Latin1_General_CP1_CI_AS, [REFERENCECATEGORY] Int, [REFERENCEID] NVarChar(20) COLLATE SQL_Latin1_General_CP1_CI_AS, [ITEMID] NVarChar(20) COLLATE SQL_Latin1_General_CP1_CI_AS, [ITEMINVENTDIMID] NVarChar(20) COLLATE SQL_Latin1_General_CP1_CI_AS, [PARTY] BigInt, [DATAAREAID] NVarChar(4) COLLATE SQL_Latin1_General_CP1_CI_AS, [RECVERSION] Int, [PARTITION] BigInt, [RECID] BigInt, [Replicate_ChangeDate] DateTime2(7), [DW_SourceCode] VarChar(15) COLLATE SQL_Latin1_General_CP1_CI_AS) with (TABLOCK)

-- Batch 4 --

IF EXISTS (SELECT * FROM INFORMATION_SCHEMA.TABLES WHERE TABLE_SCHEMA = N'dbo' AND TABLE_NAME = N'R3_AX_INVENTTRANSORIGIN_R')
BEGIN
    SELECT SUM (row_count) as [RowCount]
    FROM sys.dm_db_partition_stats
    WHERE object_id=OBJECT_ID(N'[dbo].[R3_AX_INVENTTRANSORIGIN_R]')
    AND (index_id=0 or index_id=1)
END
ELSE
BEGIN
    SELECT 0
END

-- Batch 5 --

IF EXISTS (SELECT * FROM INFORMATION_SCHEMA.TABLES WHERE TABLE_SCHEMA = N'dbo' AND TABLE_NAME = N'R3_AX_INVENTTRANSORIGIN')
BEGIN
    SELECT SUM (row_count) as [RowCount]
    FROM sys.dm_db_partition_stats
    WHERE object_id=OBJECT_ID(N'[dbo].[R3_AX_INVENTTRANSORIGIN]')
    AND (index_id=0 or index_id=1)
END
ELSE
BEGIN
    SELECT 0
END
 

Last time I did a full load on the table was yesterday and then it took the same 25 minutes, after the full load completed I ran a new load incrementally and that also took 20 + minutes with most going to the ado.net transfer. 

Userlevel 6
Badge +5

@william.sprangers can you please send screenshots of the performance metrics for the Business Unit Azure SQL DB ? (i.e. CPU percentage, Log IO percentage, etc)

Badge

@Christian Hauggaard Sure, here are some screenshots that I took during the start of a load and in the middle (starting at around 11) 


Start of load at 11

And this is during the load where the log IO spikes a bit


During the load


Userlevel 6
Badge +5

Hi @william.sprangers it appears that log IO might be the bottleneck. Could you please test scaling up the Azure SQL db to Business critical or Premium service tier?


Badge

Hi @william.sprangers it appears that log IO might be the bottleneck. Could you please test scaling up the Azure SQL db to Business critical or Premium service tier?


This seemed to be the issue, thank you Christian! 

I ran a couple of loads and saw that the Log was peaking a lot. 
 

Log IO on general purpose tier

We changed from General Purpose to Business Critical and saw that the performance improved right away. 

Reply