
This is a simple Deploy and its been running for almost 20 minutes.
Whats wrong here?
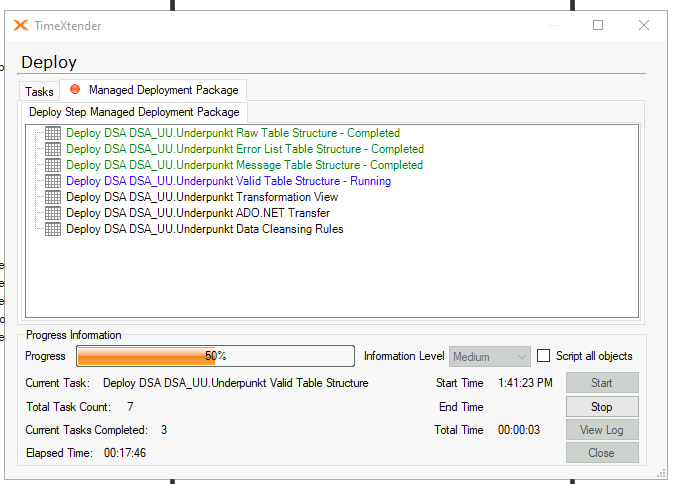
This is a simple Deploy and its been running for almost 20 minutes.
Whats wrong here?
Best answer by Christian Hauggaard
If the TimeXtender application crashed, please send an email to support@timextender.com and include the steps you took before the crash, as well as any error messages from the event viewer
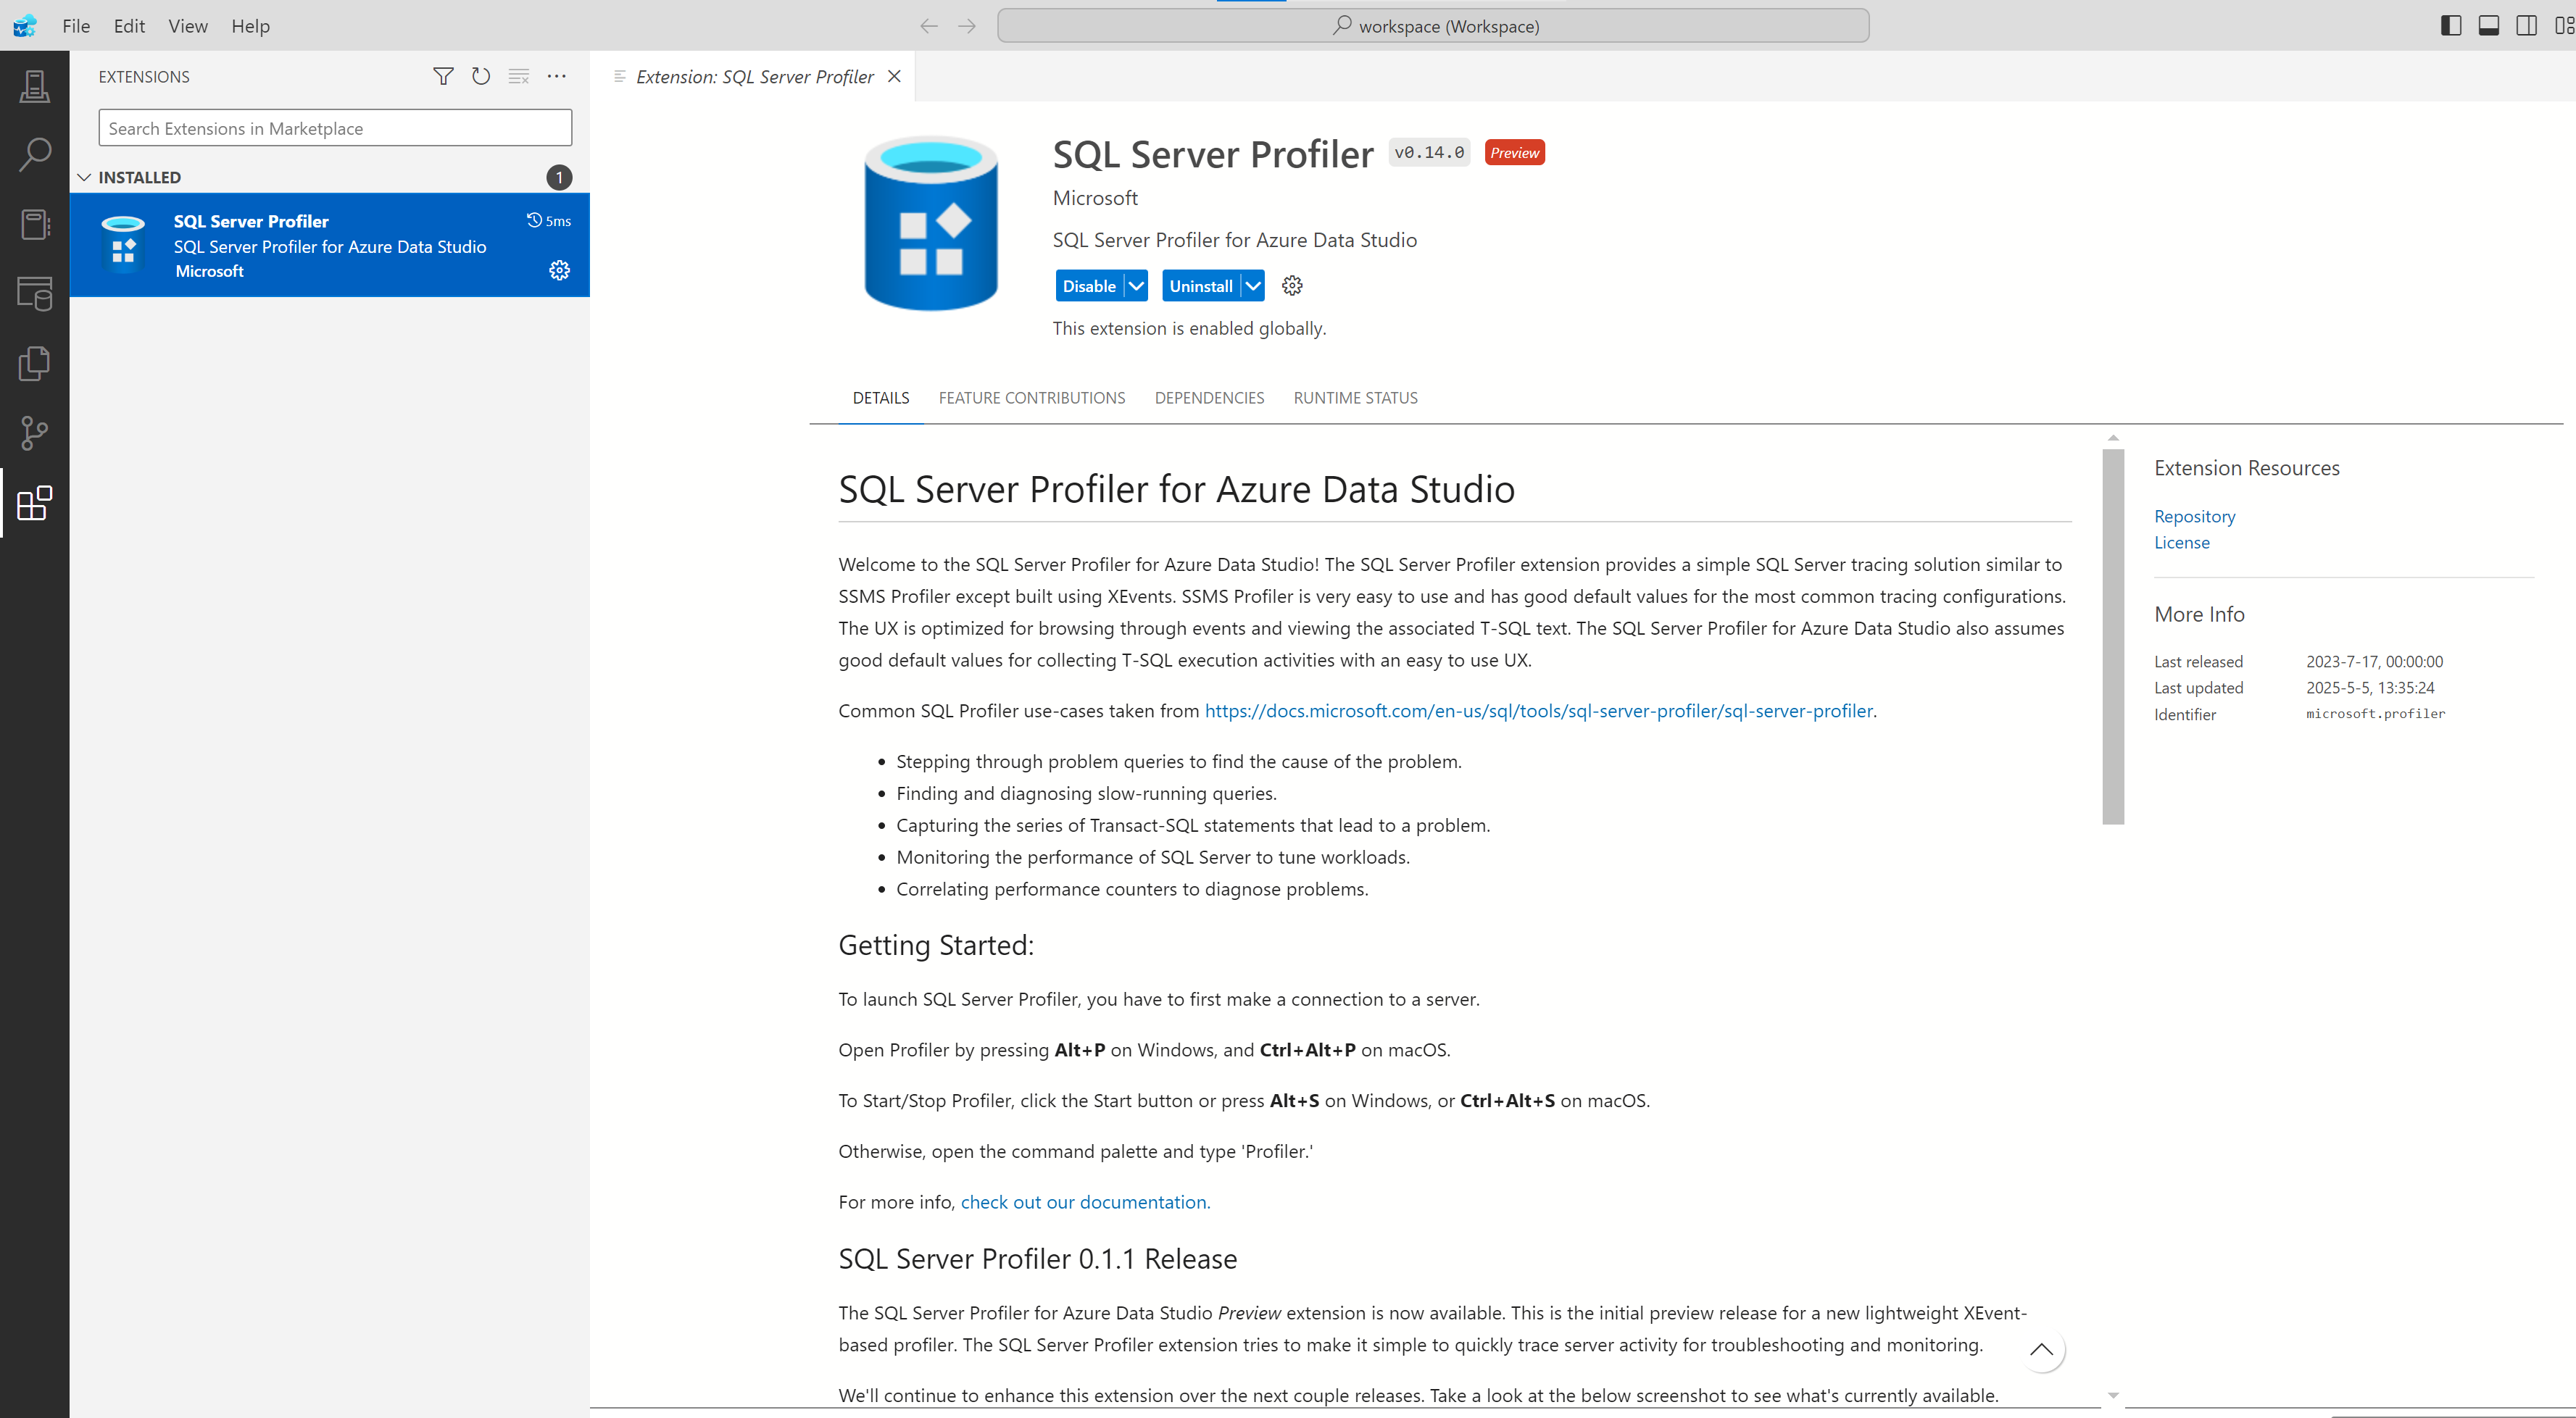
Regarding how to Run SQL Server Profiler:
Launch SQL Server Profiler
From the Windows Start Menu:
Click the Windows Start button, type "SQL Server Profiler", and select the application from the results.
From SQL Server Management Studio (SSMS):
Open SSMS, go to the Tools menu, and select "SQL Server Profiler".
From the Query Editor or Activity Monitor:
In the Query Editor, right-click and select "Trace Query in SQL Server Profiler". In Activity Monitor, right-click a process in the Processes pane and choose "Trace Process in SQL Server Profiler".
Connect to SQL Server
When Profiler opens, select "File" > "New Trace".
Enter your SQL Server instance name and authentication details, then click "Connect".
Configure the Trace
In the Trace Properties window, you can name your trace (optional).
Select a trace template (the default "Standard" is usually fine).
Choose whether to save the trace output to a file or table, or just view it in the Profiler window.
Optionally, set a stop time for the trace.
Select Events and Columns (Optional)
Go to the "Events Selection" tab.
Enable or disable specific events and columns you want to monitor, such as SQL:BatchCompleted, RPC:Completed, or ErrorLog.
You can also enable "Show all events" and "Show all columns" for more options.
Start the Trace
Click "Run" to begin capturing SQL Server activity.
The Profiler window will display real-time events as they occur.
Analyze and Save Results
Watch events live or stop the trace at any time.
To save the results, go to "File" > "Save As" and choose "Trace File" or another format.
Stop the Profiler
Stop the trace when finished to avoid using unnecessary server resources. Click the "Stop" button in the Profiler toolbar or close the application.
Enter your E-mail address. We'll send you an e-mail with instructions to reset your password.