

In this final step, you will learn how to easily load and visualize your product table into Power BI via SQL or ODBC driver. Follow the steps below to complete this training.
Note: Download Microsoft Power BI here
Load Data into Power BI
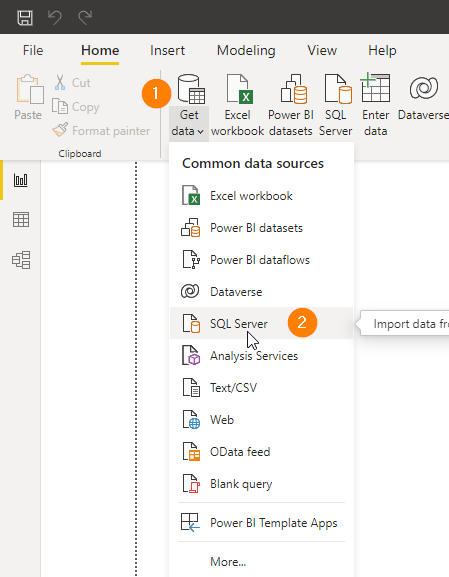
- Open Power BI, Click on Get Data
- Select SQL Server database
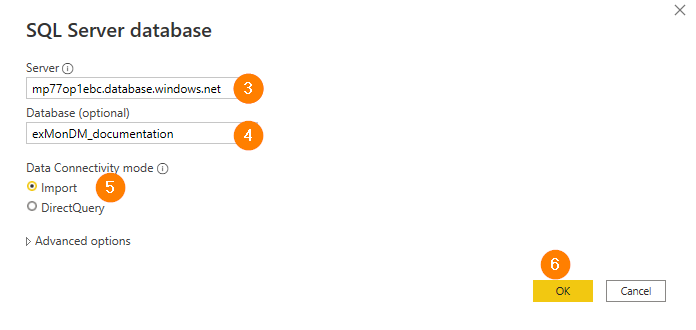
- Type in the Server (default is mp77op1ebc.database.windows.net)
- Optionally - Add a database name
- Ensure that 'Import' is selected
- Click OK
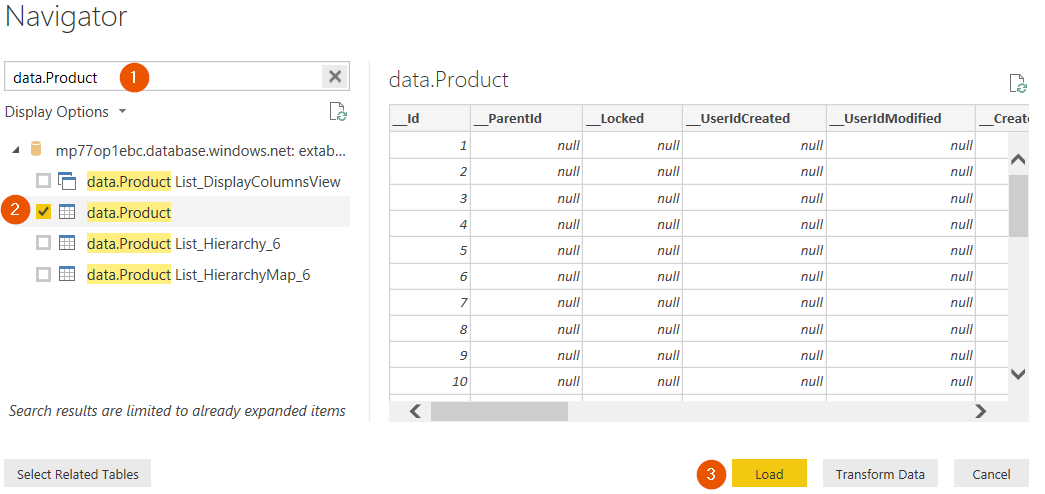
Finding your data.Product table
- Filter on data.Product in the Search Box
- Click on the Checkbox next to data.Product
- Click Load
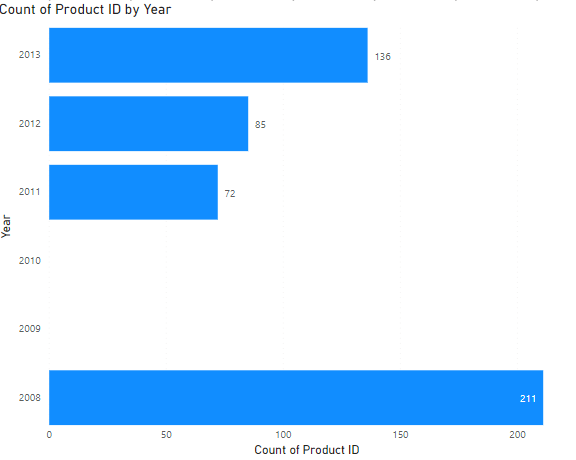
Visualizing your data
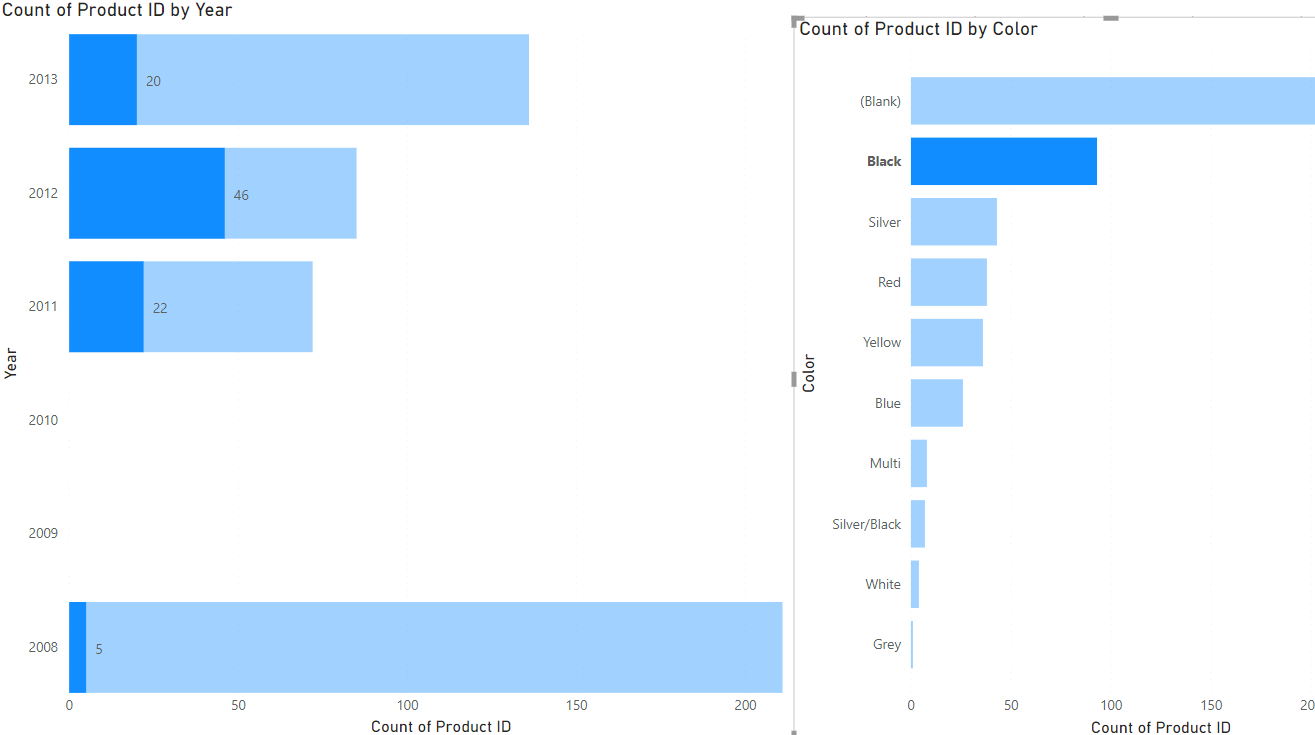
The model should now be loaded. Click on Sell Start Date and drag Product ID to Value you should see the following chart:
Click on the canvas and click on Color and drag Product ID to Value. Now we have a dashboard where we can drill down to the Product Master. We can see that there are 20 Products that are Black and started selling in 2013: