
Xpilot Error Insights for Orchestration is an AI-Powered Execution Log Analysis is a feature in TimeXtender Orchestration that uses artificial intelligence to analyze failed package executions and explain what went wrong in clear, plain language. Instead of reading through raw logs and stack traces, you get a concise summary of the root cause and concrete steps to fix the problem, plus access to the underlying log and, when available, the script that was running.
Why You Should Use It
AI-Powered Execution Log Analysis helps you troubleshoot faster and with more confidence:
- Reduces troubleshooting time: The feature translates technical error messages and stack traces into short, plain-language explanations that are easier to understand.
- Combines multiple data sources: The AI considers package configuration, data provider settings, gateway status, execution environment details, and configuration validation issues, not just the error text.
- Finds hidden root causes: By understanding package types, common failure patterns, and configuration requirements, the AI can point out underlying causes that are not obvious from the log alone, such as offline gateways, missing scripts, or misconfigured service principals.
- Provides actionable steps: You get numbered, specific steps that describe exactly what to check and where in the UI, rather than generic guidance.
- Makes scripts easier to inspect: For script-based packages (for example PowerShell, Command Line, Data Transfer, Azure CLI), the feature shows the script or command that was running in a dedicated Script tab so you can inspect it directly.
How to Use It (Base Case)
This section shows how to open a failed execution and use the AI summary to understand and fix the problem.
3.1 Open an Execution Log with AI Analysis
- In TimeXtender Orchestration, open a Process Map from the left navigation.
- Select a task in the process map that has recent executions, or go to Executions to see all execution history.
- In the execution history grid, locate an execution with status Failed (red indicator).
- Click the failed execution row to open the Execution Log modal.
While the modal opens, you see a loading spinner while TimeXtender:
- Loads the execution log.
- Runs AI analysis for the failed package task.
-
3.2 Read the AI Summary
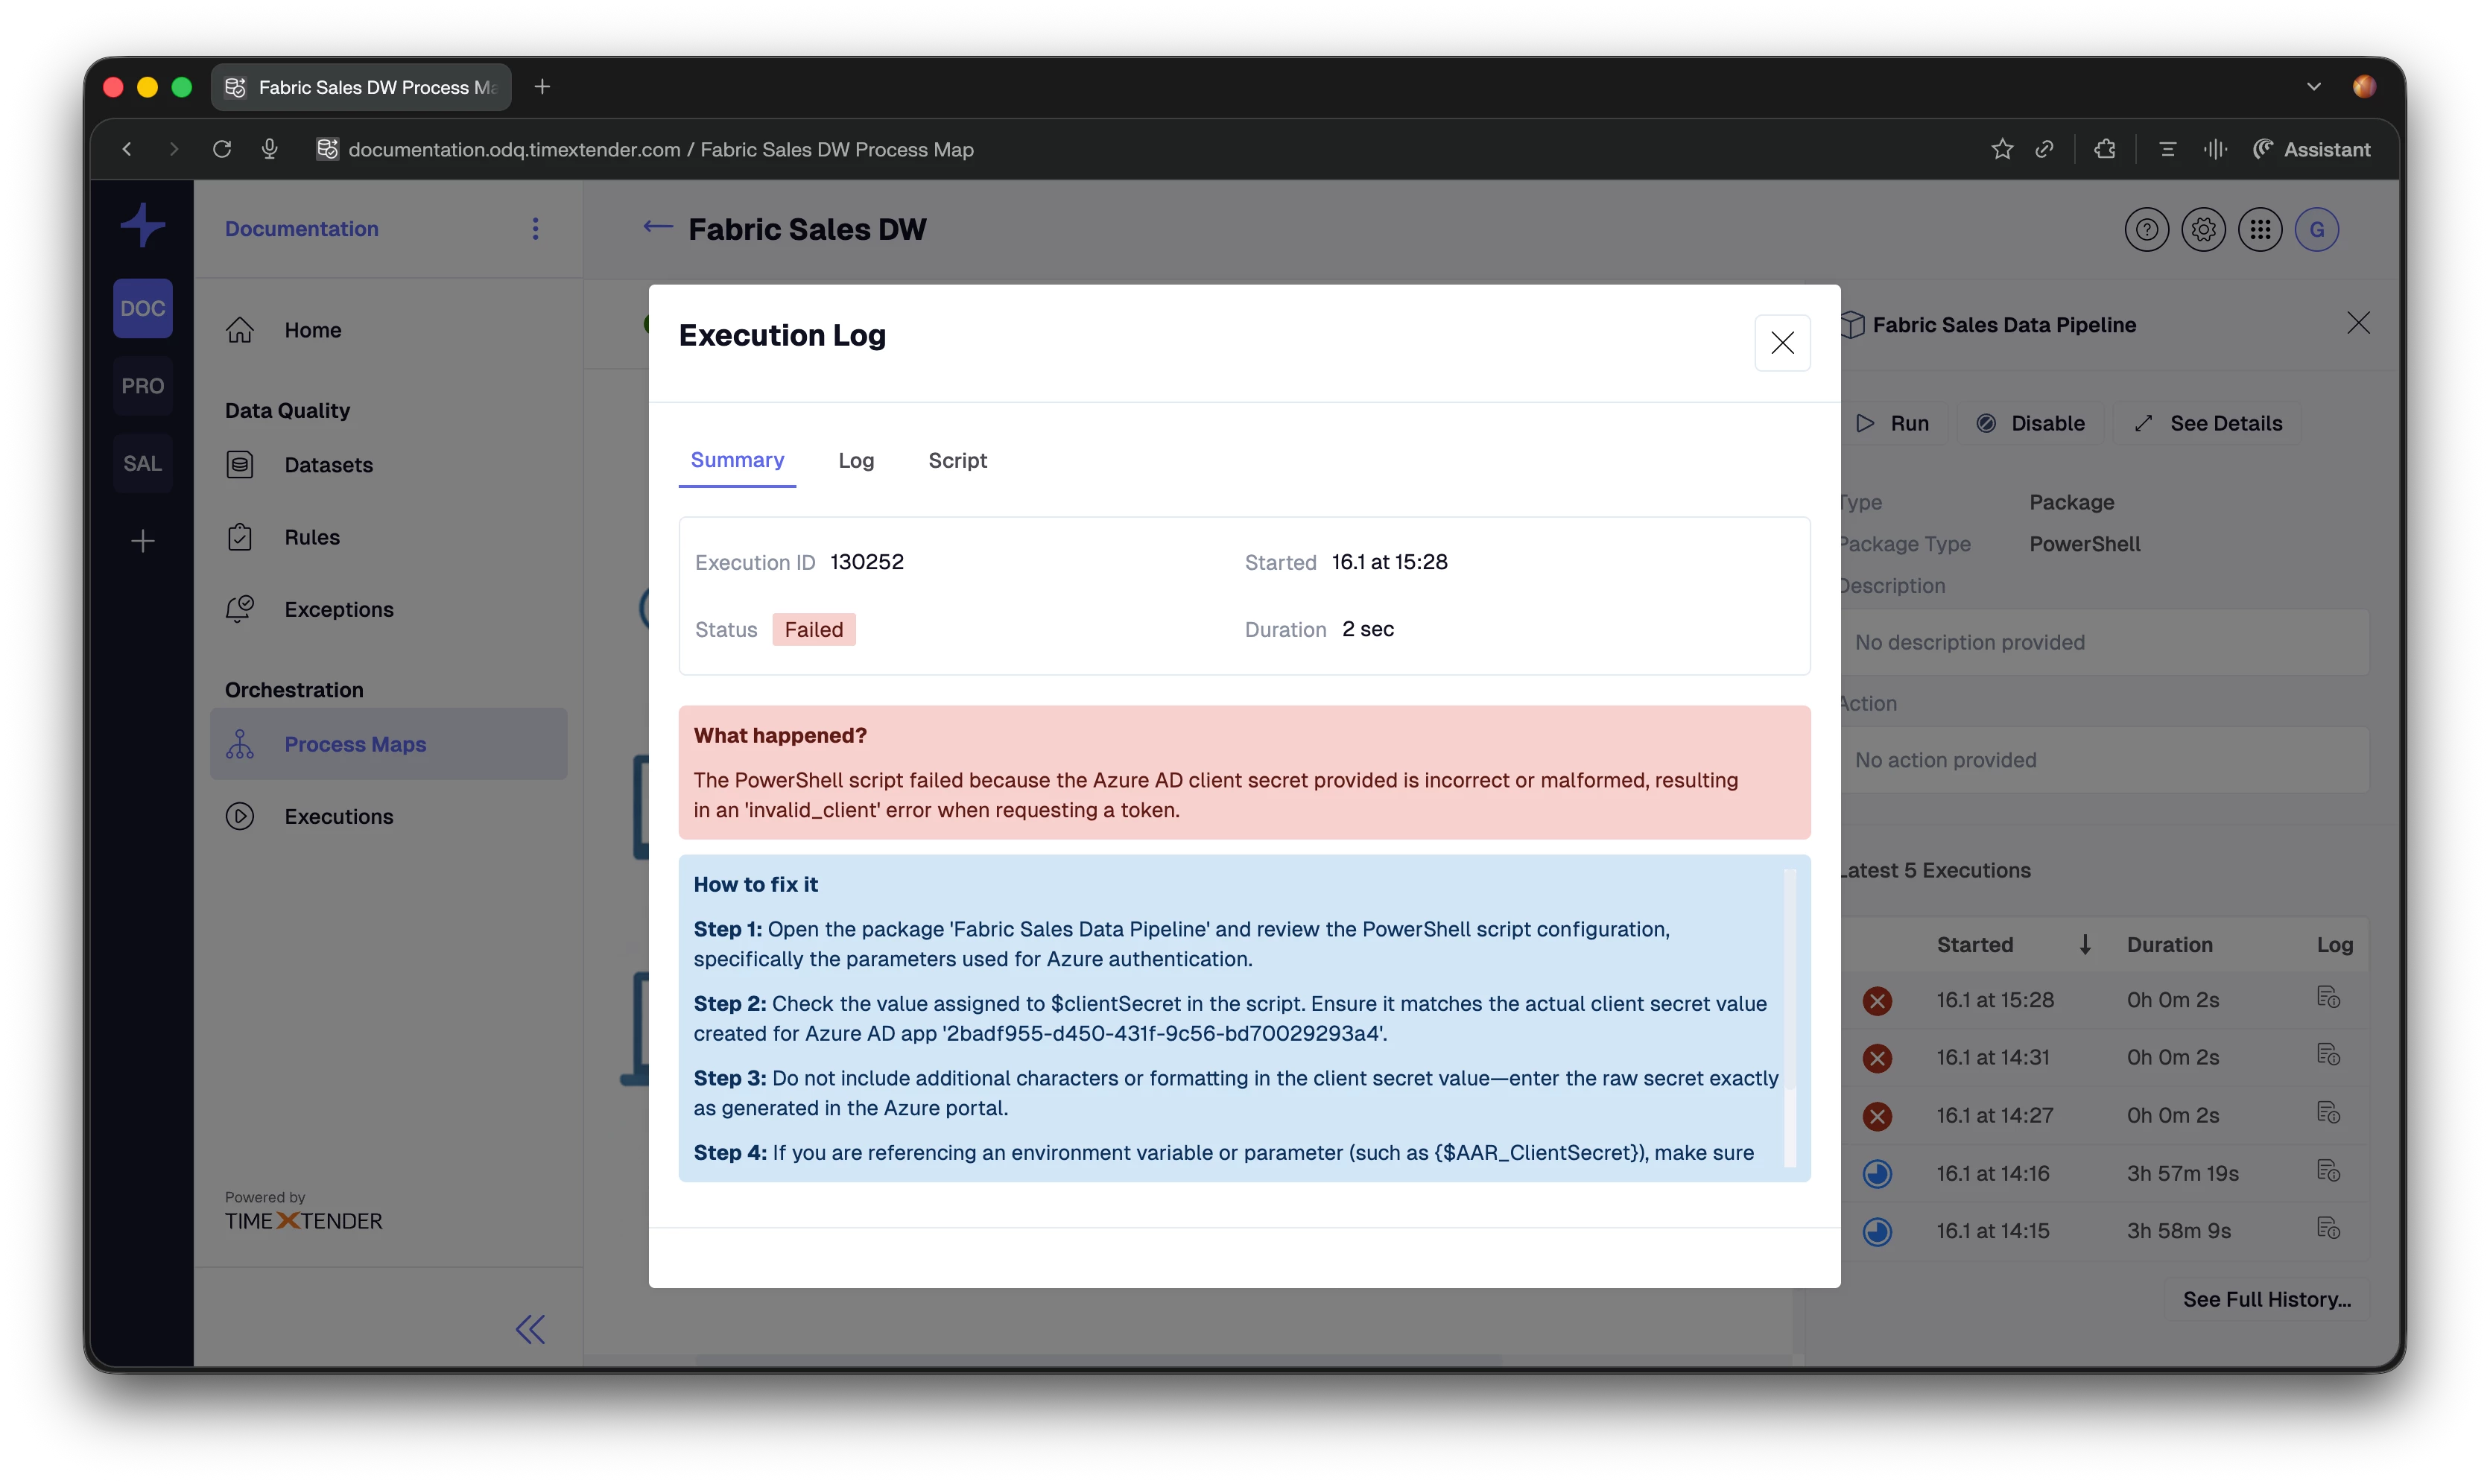
When the Execution Log modal finishes loading, it opens on the Summary tab. At the top, you see execution details:
- Execution ID – the unique identifier for this execution.
- Started – date and time when the execution started.
- Status – current state (Failed, Finished, Running).
- Duration – how long the execution ran.
For failed package executions, the AI summary appears below as two clearly separated message boxes:
- “What happened?” A short, 20–30 word explanation that describes the root cause of the failure in plain language.
- “How to fix it” Numbered, step-by-step instructions that tell you exactly what to do next, including which package and which settings to check.
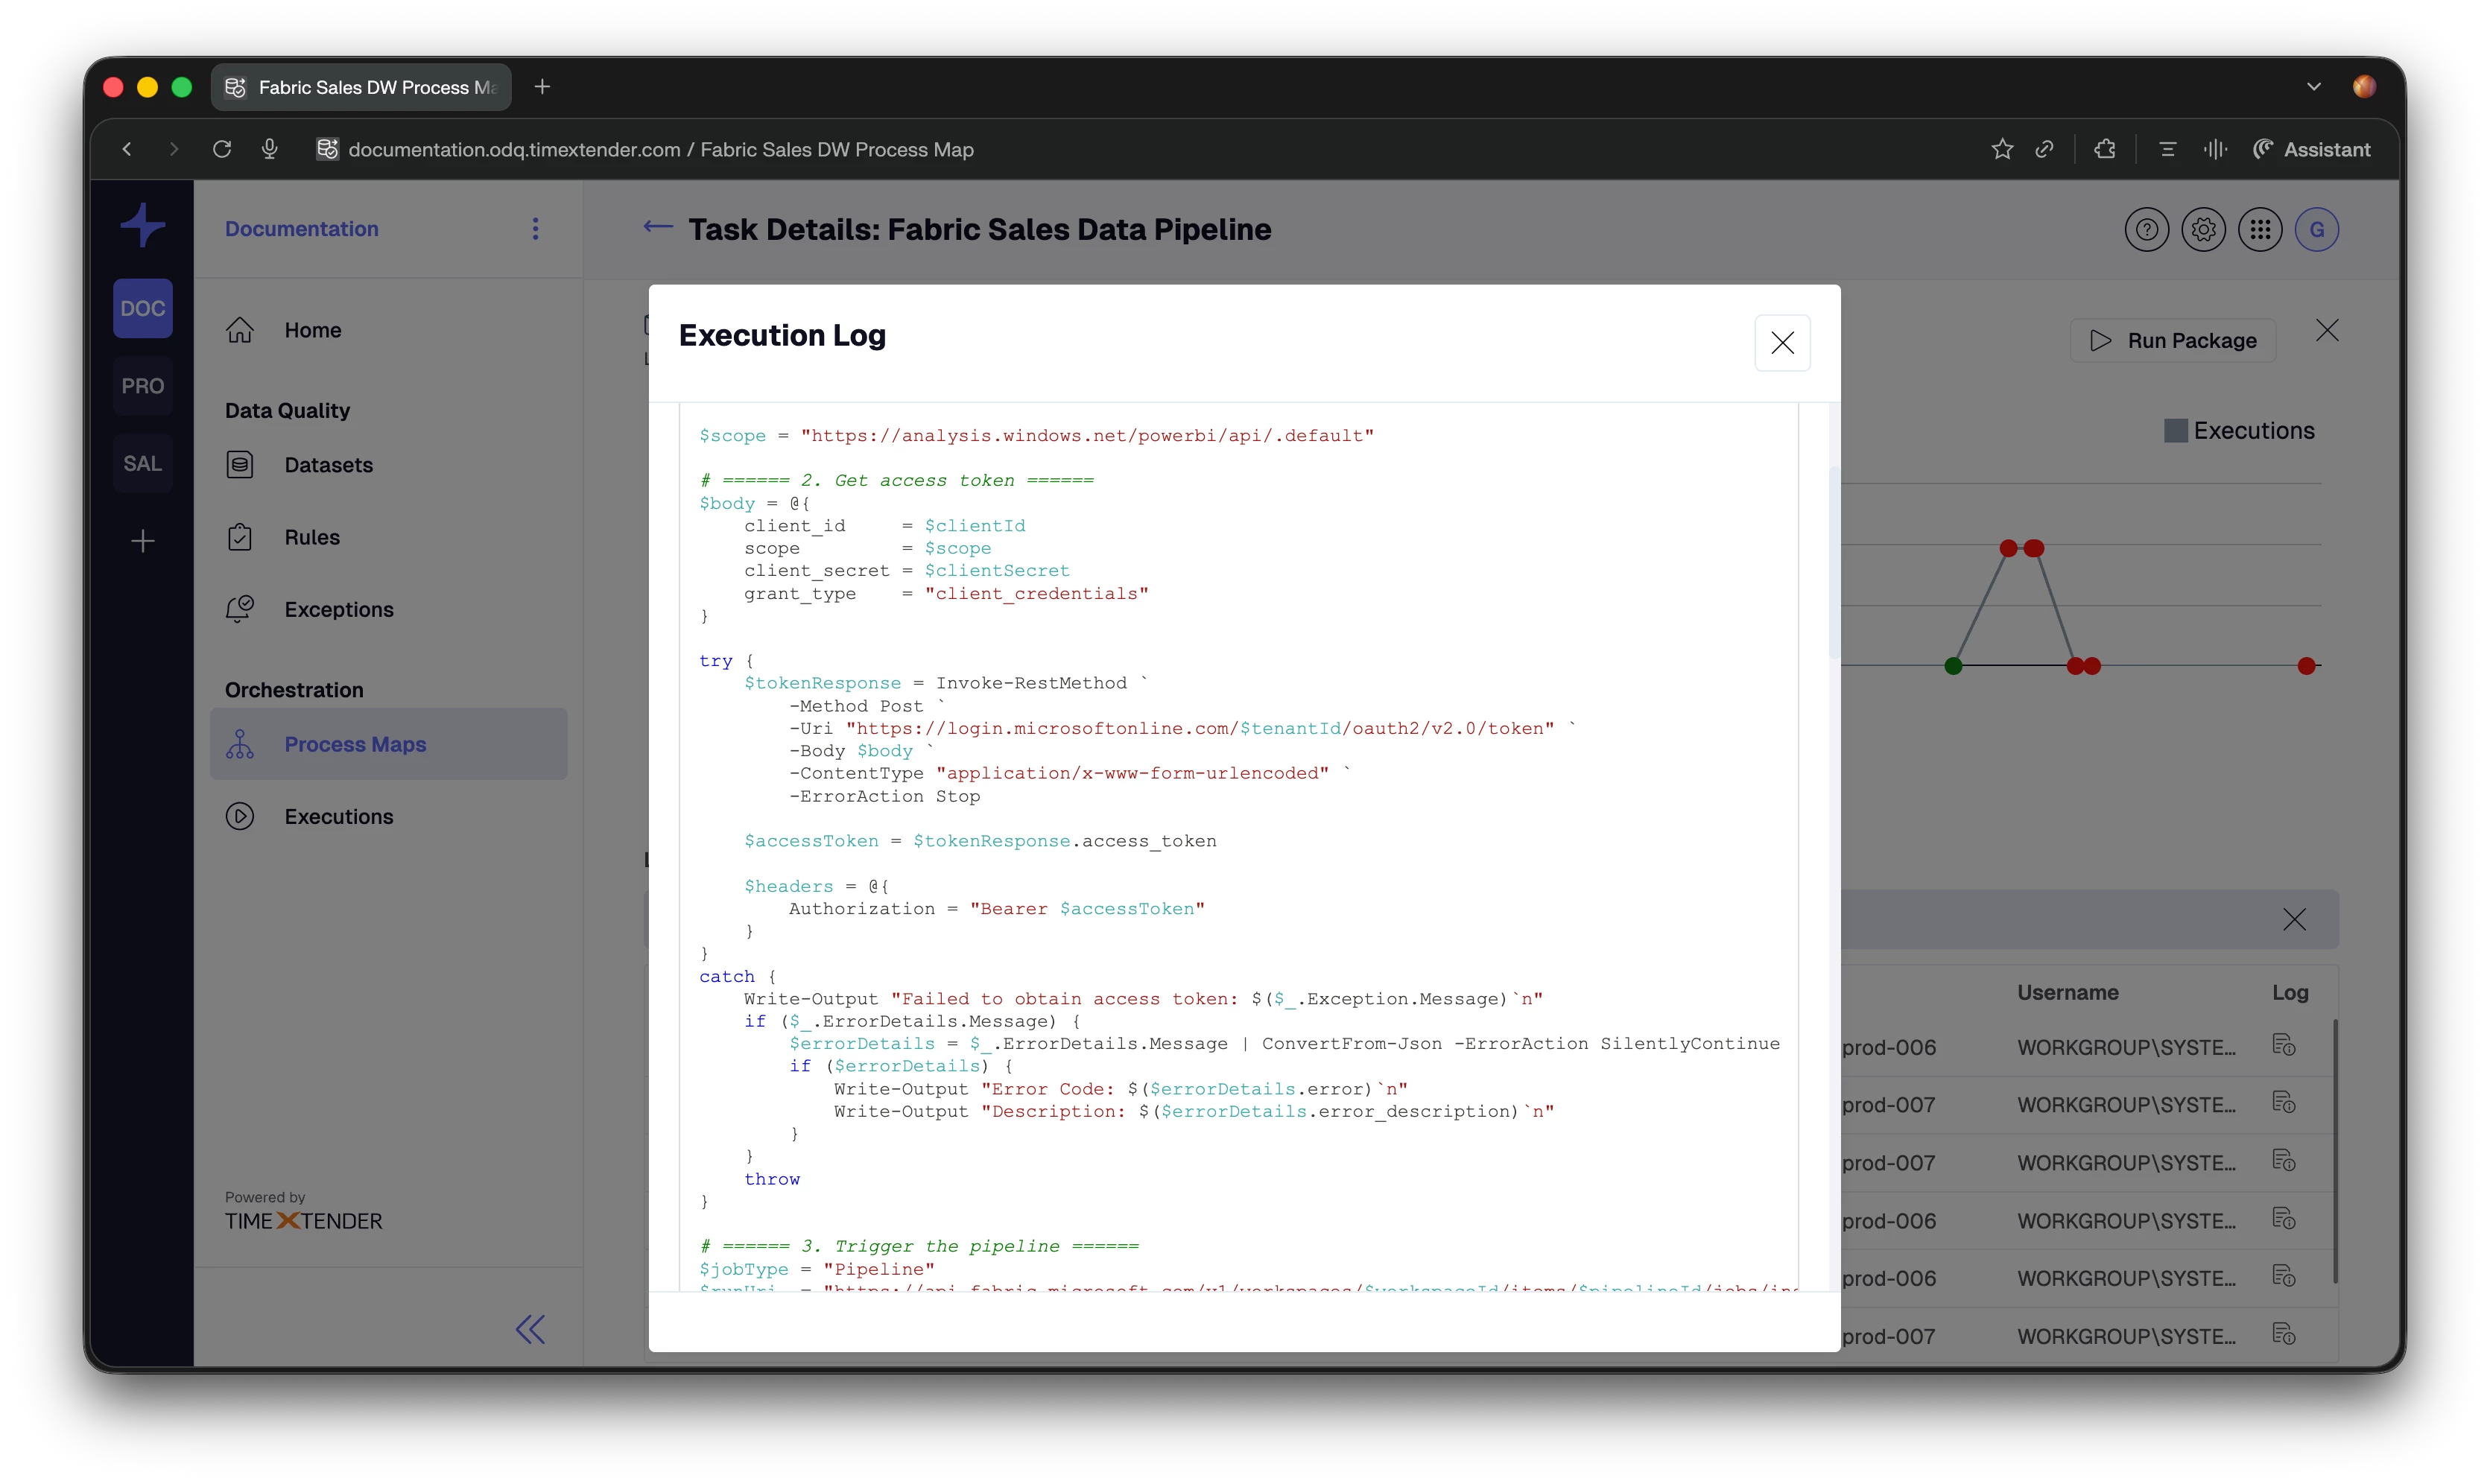
3.3 Check the Raw Log and Script (When Needed)
From the same modal, use the other tabs to dig deeper when necessary:
- Log tab: Shows the full execution log, including error messages, stack traces, and other technical output. Use this when you need to copy error details, open a support ticket, or investigate low-level technical behavior.
- Script tab (when available): For script-based package types, a third tab appears, named Script ([Package Name]). It shows the actual script or command that ran for this execution in a syntax-highlighted viewer.
This is supported for:
- PowerShell – PowerShell script content.
- Command Line – the command being executed.
- Data Transfer – source and/or destination SQL.
- Data Provider – custom script or stored procedure.
- Azure CLI – Azure CLI script.
- Azure Databricks – job parameters.
Cloud-based packages such as Azure Data Factory, Azure Synapse, Power BI Refresh, TimeXtender SaaS tasks, and similar do not show a Script tab because the executable code resides in the external service.
What the AI Analyzes
The AI does more than read the last error message. It considers several aspects of the execution to provide a reliable diagnosis.
4.1 Configuration Validation
Before looking at the error itself, the AI checks for obvious configuration problems, such as:
- Missing or empty scripts.
- Unconfigured data providers.
- Missing required parameters.
- Invalid or incomplete connection settings.
When these are detected, they are highlighted in the “What happened?” and “How to fix it” messages so you can correct them first.
4.2 Gateway Health
For packages that execute through a gateway, the AI checks:
- Whether the gateway is online and recently connected.
- When the gateway last connected.
- Version compatibility between server and gateway.
- Potential network connectivity issues that could prevent execution.
4.3 Package-Specific Context
The AI understands key requirements and common failure causes for different package types, including more than 18 package categories.
- Required parameters and settings for each type.
- External dependencies, such as APIs, databases, and services.
- Typical error patterns seen for that package type.
- Known configuration pitfalls and how to avoid them.
4.4 Error Log Content
Finally, the AI examines the actual error log:
- Error messages and stack traces.
- Timeout and connection errors.
- Permission and authentication failures.
- Data-related errors such as missing tables, type mismatches, or invalid queries.
The result is a combined view that explains both “what happened” and “why it happened,” not just the final error line.
Example Scenarios
These examples illustrate how the AI summary appears and how the guidance is structured.
Scenario 1: Missing PowerShell Script
- What happened? “PowerShell script is not configured. The package 'Daily Sales Import' cannot execute without a script.”
- How to fix it:
- Open the package “Daily Sales Import” in the TimeXtender portal.
- Go to the PowerShell script configuration section.
- Add a valid PowerShell script that performs the required data operation.
- Save the package and re-run the task.
Scenario 2: Gateway Offline
- What happened? “The gateway 'PROD-GW-01' has not connected in over 24 hours. The package cannot reach the remote execution environment.”
- How to fix it:
- Check if the gateway service is running on machine “PROD-GW-01.”
- Verify network connectivity between the server and the gateway machine.
- Review Windows Event Logs on the gateway machine for service errors.
- Restart the TimeXtender Gateway service if needed, then re-run the task.
Scenario 3: Azure Authentication Failure
- What happened? “Azure authentication failed for the Databricks package. The service principal credentials may be invalid or expired.”
- How to fix it:
- Verify that the Azure AD application (client ID) is still active in Azure portal.
- Check whether the client secret has expired and create a new one if required.
- Update the data provider settings in TimeXtender with the new client secret.
- Ensure the service principal has appropriate permissions on the Databricks workspace.
- Save changes and re-run the task.
Tips for Best Results
A few habits make AI-Powered Execution Log Analysis even more effective:
- Check configuration validation first: If the AI mentions missing scripts, unconfigured data providers, or required parameters, fix those issues before investigating deeper.
- Review gateway status for remote tasks: When a remote or cloud-related task fails, gateway health is often the quickest clue, especially for timeouts and connectivity errors.
- Use the Script tab for script errors: When a script-based package fails, read the Script tab to spot syntax errors, incorrect object names, or logic issues.
- Combine AI summary with raw log: Use the AI summary to understand the failure quickly, then use the Log tab for additional technical context when needed.
- Follow the steps in order: The “How to fix it” instructions are ordered by priority. Start with Step 1 and work downward to avoid skipping critical checks.
Important Notes and Limitations
Keep the following in mind when using AI-Powered Execution Log Analysis:
- AI analysis is currently available for package tasks. Other task types (for example, rules or manual tasks) still display the standard execution log without AI analysis.
- The Script tab is only shown for package types where TimeXtender stores the executable code. For cloud-based services like Azure Data Factory or Power BI, the script runs in the external platform and is not available in the UI.
- The feature uses a large language model (LLM) to generate explanations and guidance, but your data is not used to train the model. The model is only used at runtime to analyze your execution context.
- TimeXtender does not send entire datasets to the LLM. The analysis is based on execution metadata, configuration, logs, and related context, not full data volumes.
- AI can make mistakes. Treat the analysis as guidance and always verify suggestions against your environment, security requirements, and configuration.
Troubleshooting
Use this table to resolve common issues with AI-Powered Execution Log Analysis:
| Issue | Possible Cause | Recommended Action |
|---|---|---|
| AI analysis not appearing | The task is not a package task or the execution did not fail. | Confirm the task type is a package (for example EBI_PACKAGE) and that the selected execution has status Failed. |
| Script tab not showing | The package type does not store executable code in TimeXtender (for example Azure Data Factory, Power BI Refresh). | Verify the package type. Script tab is only available for PowerShell, Command Line, Data Transfer, Data Provider, Azure CLI, and Databricks packages. |
| AI analysis shows “No obvious issues” | The failure may be caused by environmental conditions or data characteristics that are not fully visible in configuration or logs. | Review the raw log in the Log tab and check infrastructure (network, credentials, external services) for additional clues. |
| Loading takes too long | AI analysis relies on external API calls. Network latency or connectivity issues can slow down loading. | Check network connectivity and try again. If delays persist, review any proxy/firewall configuration that might affect outbound calls. |
| Execution log modal opens without analysis | AI features are disabled or not available in your environment. | Confirm that AI features are enabled in your service settings and that your environment is configured to use XPilot AI capabilities. |
This feature makes execution logs less intimidating, more informative, and directly actionable, helping you understand failures faster and get your orchestrations running again with clear, guided steps.
