

The TimeXtender Ingest Instance Service (“TIS”) has a few different ways for you to keep track of what it is doing and what it has done.
Executions and service activity is logged to give you insights that can help e.g. debugging issues. With the Execution Queue, you can keep track of what the Ingest Instance Service is currently executing and about to execute. In addition to that, the service also collects some statistics on storage usage.
View queued and currently running tasks
In the Execution Queue, you can see the tasks that are currently executing, waiting to start or just finished executing.
To open the Execution Queue
- Select the Ingest instance in the Solution Explorer and then, in the Tools menu, click Ingest Instance Execution Queue.
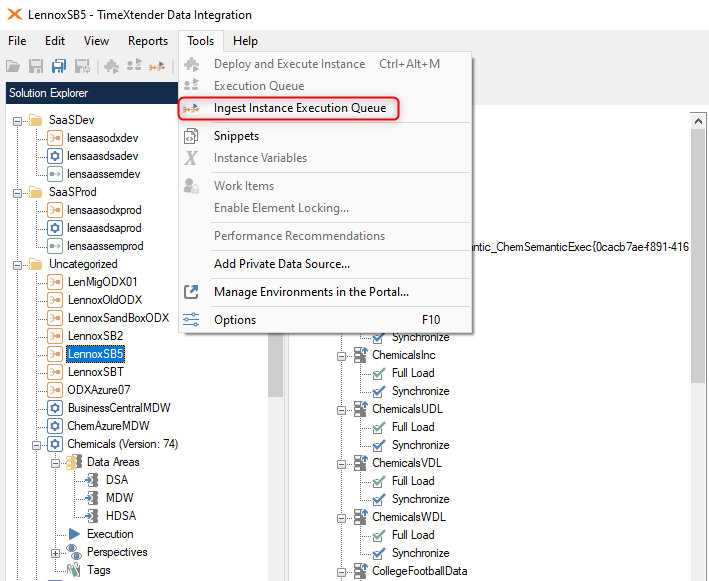
The Ingest Instance Execution Queue shows currently running, pending tasks and recently completed tasks.

You have the following options:
- You can click on Refresh or press F5, to see updated tasks.
- You can click on Stop, If you click on a running task, a Stop button will appear, that can be used to stop a task execution
- You can click on Remove to remove a pending or completed task.
View previously executed tasks
Note: This section describes the logging functionality in TDI v. 7xxx.1 and later. The old Execution Log and Service Log from earlier versions has been deprecated and is marked as such in the UI. To use deprecated features, Show Deprecated Features in the View menu.
The Ingest instance services logs all execution attempts to log files in the local file system in the W3C Extended Log File Format. The Execution Log reads these files to show you all the previous task executions. You can open the log on the instance level or scoped to a specific task.
To view executions for the entire instance
- Right-click the ingest instance and click View Execution Log.
To view executions for a specific task
- Right-click the task and click View Execution Log.
In the Execution Log window, the top list shows the task, while the bottom list shows the details for a selected tasks.
In the left-hand side of the window, filter options are available:
- Time span (From and To dates and time)
- Type of task:
- All: All the rows in the given timespan
- Standard: All transfer execution tasks
- Outbound (transfer): Tasks transferring from Ingest → Prepare.
- Outbound (merge transfer): Tasks using the ADF merge threads option for transferring from Ingest→ Prepare.
- Outbound (preview): When someone is previewing a table.
- Clean-Up: Clean up tasks.
- Security Setup: The tasks that adds security to a data source.
- Start type:
- All: Is all the tasks
- Manual: Manually started tasks.
- Scheduled: Scheduled tasks.
In the Detail list, the messages are often too long for the column. To open the Log Entry Details window to see the full message. double-click the item in the Details list.
In the Log Entry Details window, the properties of the message is displayed in the top table followed by the message itself.
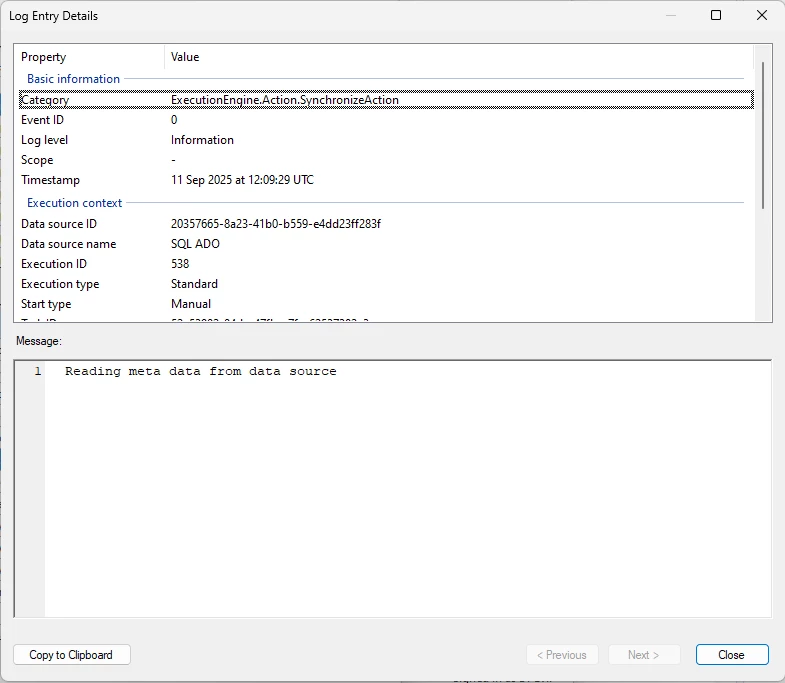
To move the the next or previous message within the same task execution, click < Previous or Next >. Click Copy to Clipboard to copy the message to the clipboard for sharing.
View service activity
In the same way executions are logged, the Ingest Instance Service also logs the communication between the TDI application and the service itself.
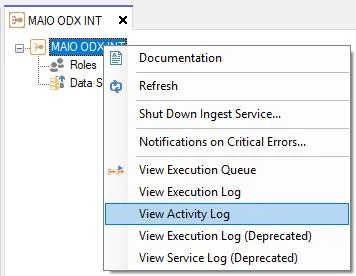
To open the Activity Log
- Right-click on the Ingest instance and select View Activity Log.
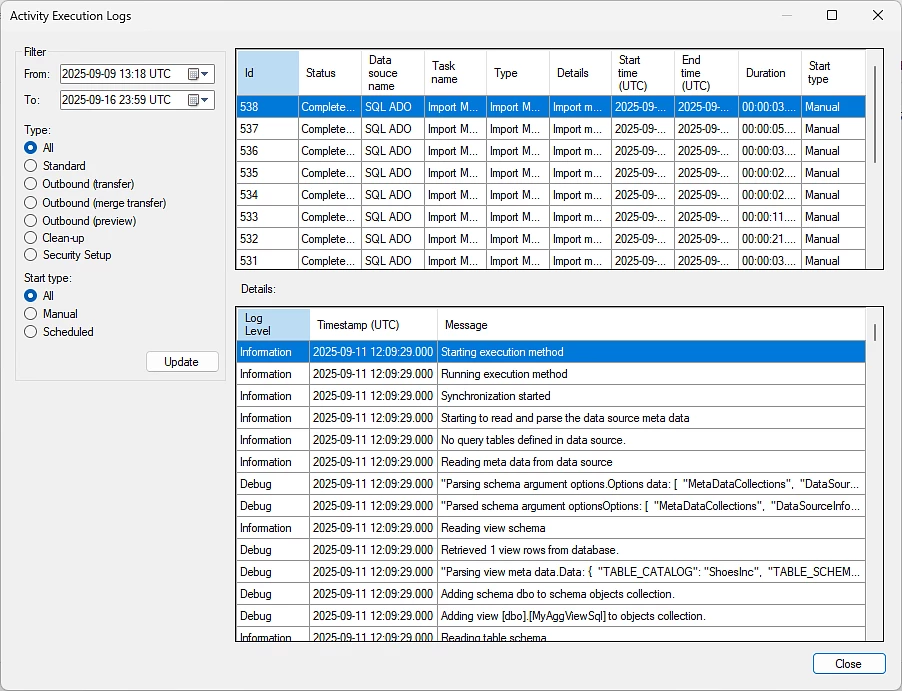
The Activity Log window lists the log entries. The list is limited to 10,000 items per page.
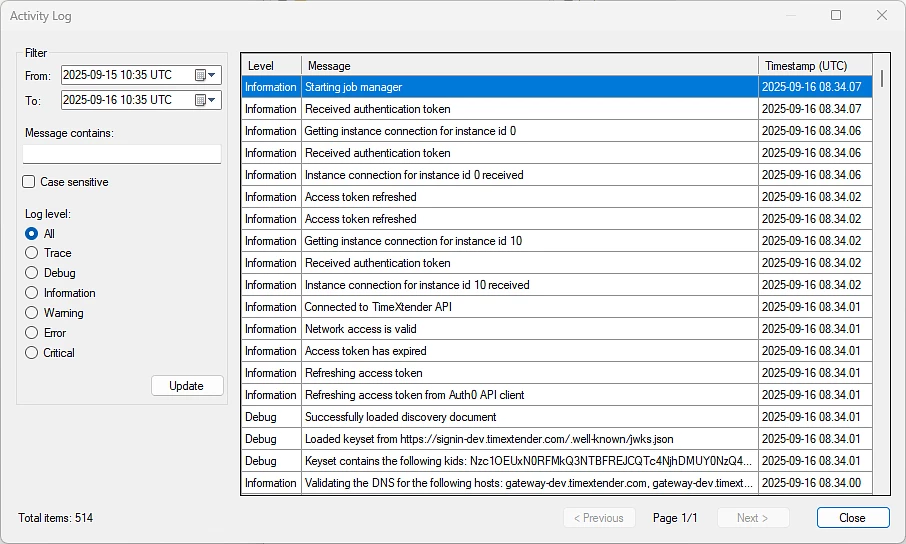
In the left-hand side of the window, filter options are available:
- Time span (From and To dates and time)
- Message contains with optional Case insensitive setting to filter out entries that do not contain the string you’ve entered.
- Log level:
- All
- Trace
- Debug
- Information
- Warning
- Error
- Critical
In the list, the messages are often too long for the column. To open the Log Entry Details window to see the full message, double-click the item in the list.
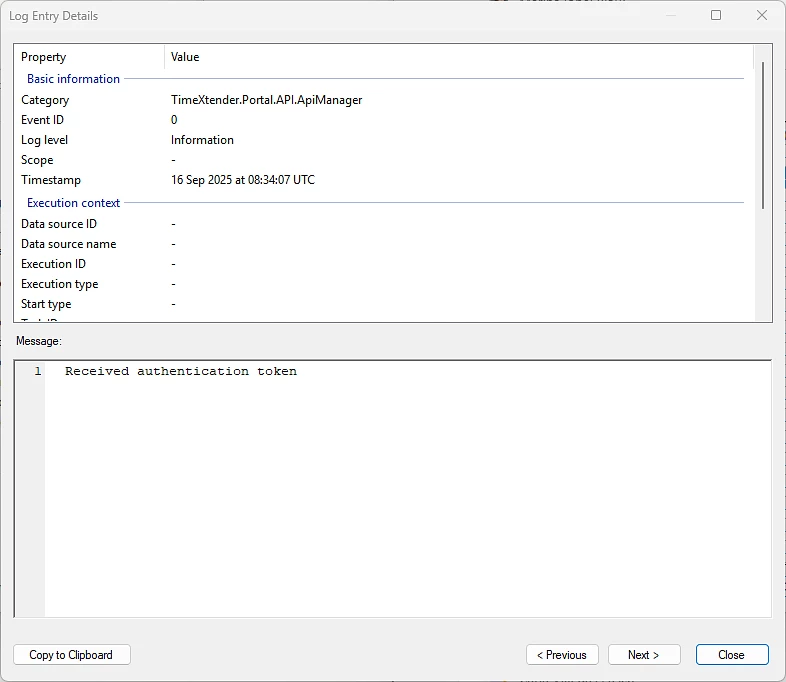
To move the the next or previous message within the same log entry, click < Previous or Next >. Click Copy to Clipboard to copy the message to the clipboard for sharing.
Log configuration
When you configure the Ingest service - using the Ingest Service Configuration tool - you have options for configuring how logging works.
The following logging options are available on the Advanced Options page:
- File logging level: What detail level gets written to log files. Defaults to ‘Debug’.
- Event Viewer logging level: What appears in Windows Event Viewer. Defaults to ‘Error’.
- Log files path: Where activity logs are stored.
- Log retention period: How long to keep log files. Default is 7 days.
- Log cleanup interval: How often system removes old logs. Defaults is 1 hour.
- Max log file size: When to start a new log file. Defaults is 500 MB.
View data source and data storage statistics
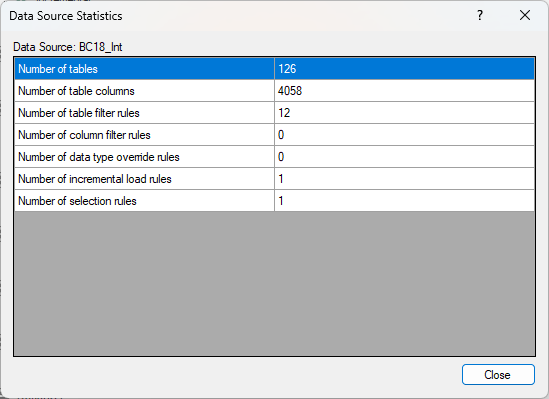
The Ingest instance service collects some statistics on the data source and data storage. On the data source, you can see e.g. how many tables and columns are available. On the data storage the number of tables and columns and the total data consumption is listed.
To view the statistics of a data source
- Right click a data source and click Statistics
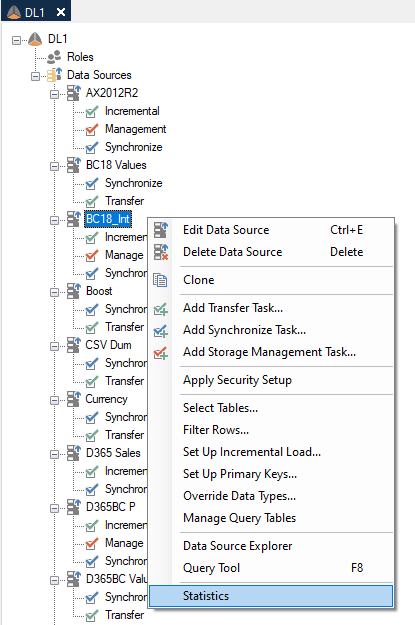
It will give information looking like this.
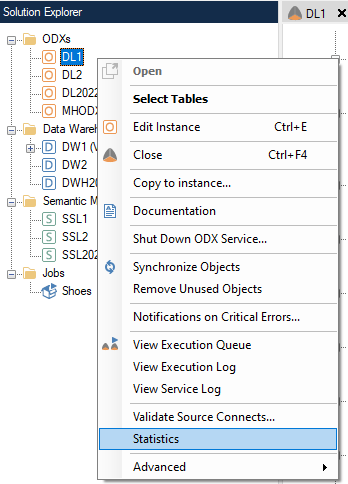
For the entire Ingest Instance you can also see it. You open it like so.
- Right-click on an open instance and click Statistics
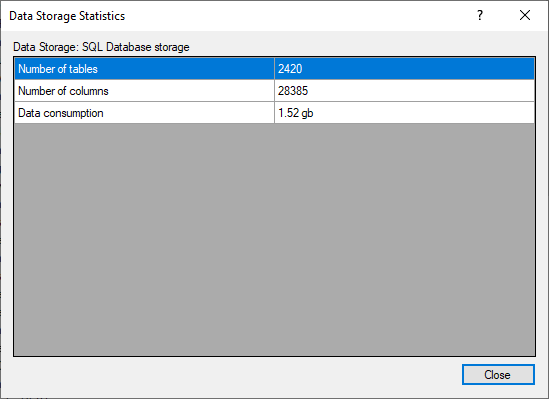
The data storage statistics will depend on whether the ingest instance storage is set to use an SQL Server database or an Azure Data Lake Gen2 container.
SQL Database Storage
When the storage is to use an SQL Database, the following three data storage statistics will be displayed.
- Number of tables - count of tables within the database.
- Number of columns - count of columns across all tables in the database.
- Data consumption - the size of the data stored, typically displayed in gigabytes or megabytes.
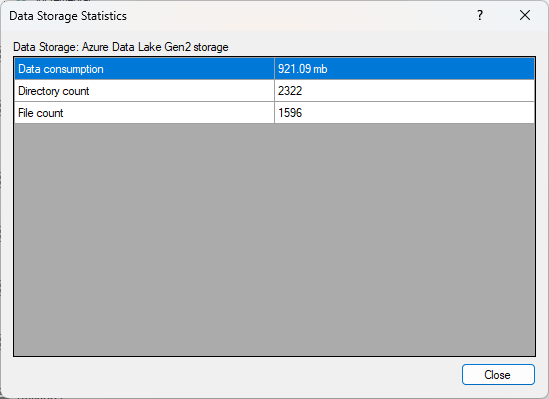
Azure Data Lake Gen2 Storage
When the storage is to use an Azure Data Lake Gen2 container, the following three data storage statistics will be displayed.
- Data consumption - the size of the data stored, typically displayed in gigabytes or megabytes.
- Directory count - the total number of directories present in the storage container.
- File count - the total number of files stored within the storage container.