
Hello,
TimeXtender 20.10.51
I’m looking for support with an issue we’re experiencing where execution packages are running but no tasks are being completed while causing 100% usage on the repository.
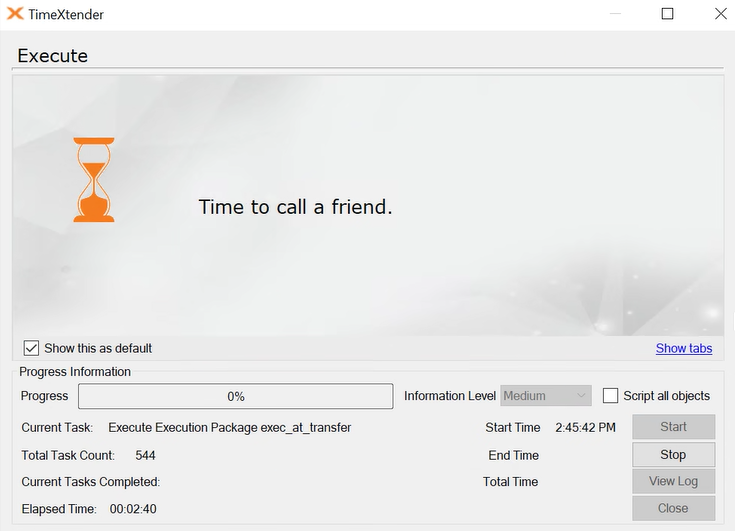
After deploying to production, we ran a package manually and noticed it not proceed past the above step. The “current tasks completed” stayed at 0, and no data was being loaded, even after waiting up to 30 minutes. We tried running it multiple times, but nothing changed. Running individual tables worked fine.
We checked the SQL database usage for the DSA to be sure, and it wasn't being affected—no data was loading as expected.
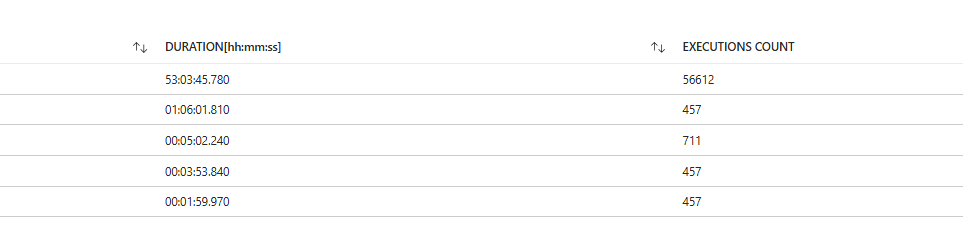
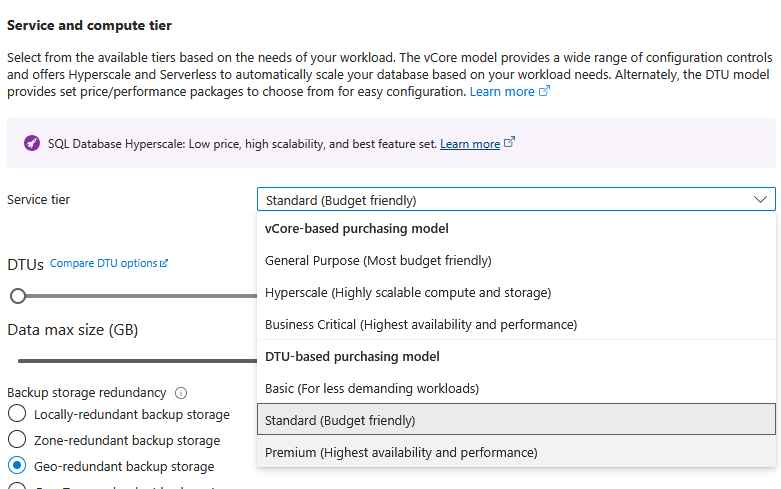
While troubleshooting, we found that the repository (a standard 100 DTU Azure SQL database) was hitting 100% data IO and DTU usage. One query, in particular, was using nearly all the available resources. It was this query:
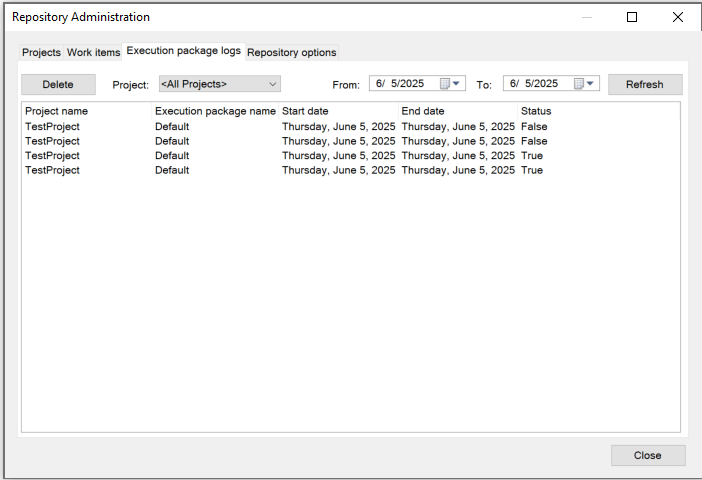
(@ObjectId uniqueidentifier)SELECT [StepId], AVG(DATEDIFF(s, [Start], [End])) AS [AvgSeconds] FROM [dbo].[ExecutionPackageLogDetails] WHERE [ObjectId] = @ObjectId AND [Start] IS NOT NULL AND [END] IS NOT NULL GROUP BY [StepId]Anyone know exactly what this query is? If I was to guess, it’s created in regards to execution packages logging?
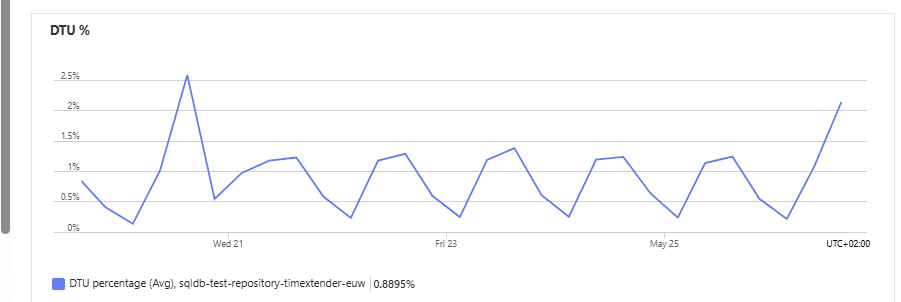
We increased the repository to 200 DTU but it still got stuck and reached 100% usage. Interestingly, our test environment is an exact copy of production. It uses the same repository setup (yet only 100 dtu) and scheduled loads, but the same query runs there with much lower IO usage.
This is the test repository looking over 7 days.
This is prod
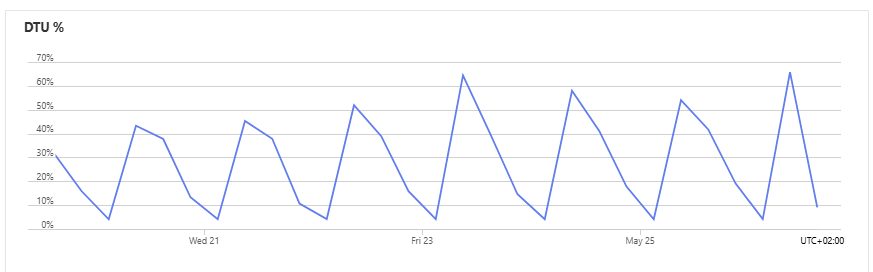
Like I said, these environments are 1 to 1 and running exactly the same amount of loads every day. I can’t find any explanation for this.
Anytime we start a package the repository instantly goes to 100% in prod and drops to 0% when we stop the package.
Anyone here experience something similar or knows why running a simple execution package can sink an entire repository database?
Appreciate any help or support if anyone has any insight.