The Table builder is a powerful tool in the REST and JSON & XML data source providers that you can use to transform nested XML or JSON data into a flattened table with columns and rows by using simple drag-and-drop functionality to define XSLT code.
This guide will walk you through the various features and steps involved in using the table builder.
To use the table builder, you need a REST or JSON & XML data source set up and mapped to a running Ingest instance.
Add table flattening
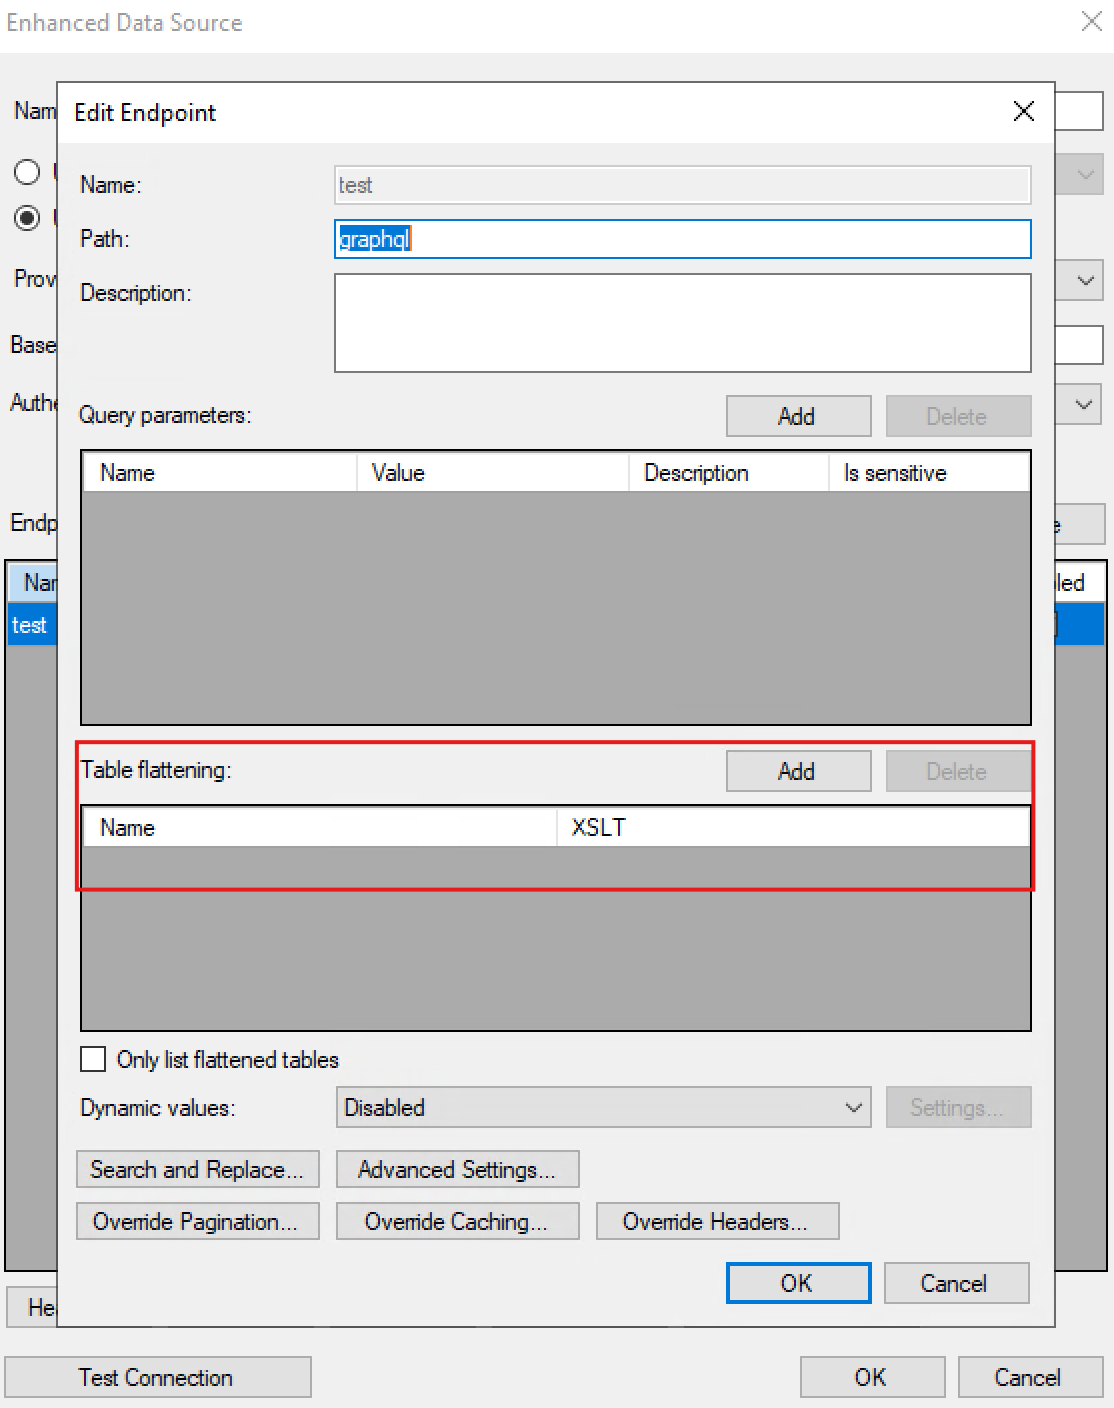
The first step is to add a flattened table to an endpoint.
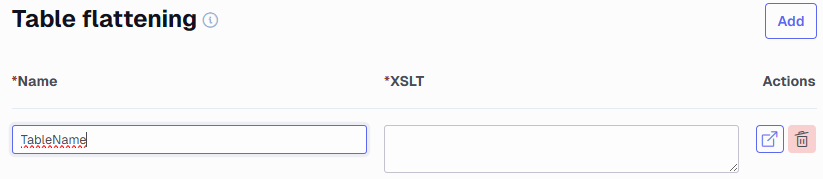
Open your data source, expand the endpoint, click Table flattening under Additional configurations and then click Add.
Give your table flattening a name (this will be your resulting flattened table name) and click the Open button to open the table builder interface.
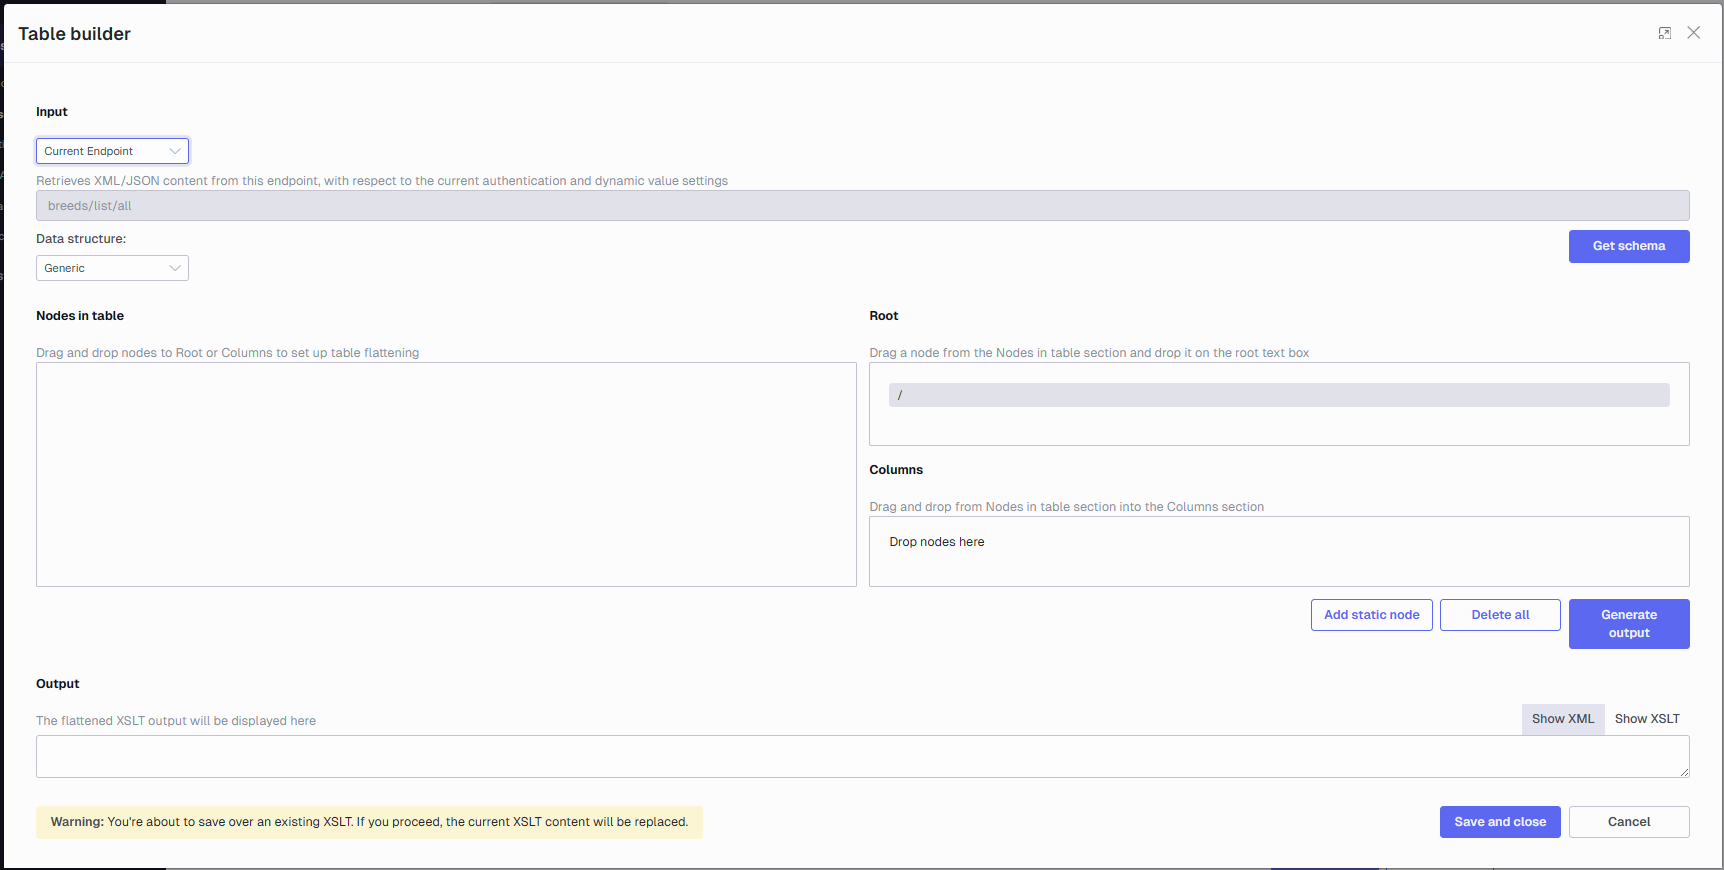
The table builder interface consists of 5 different sections:
Input: Here, you paste in the XML or JSON you want to flatten and also select the applicable data structure for your input data.
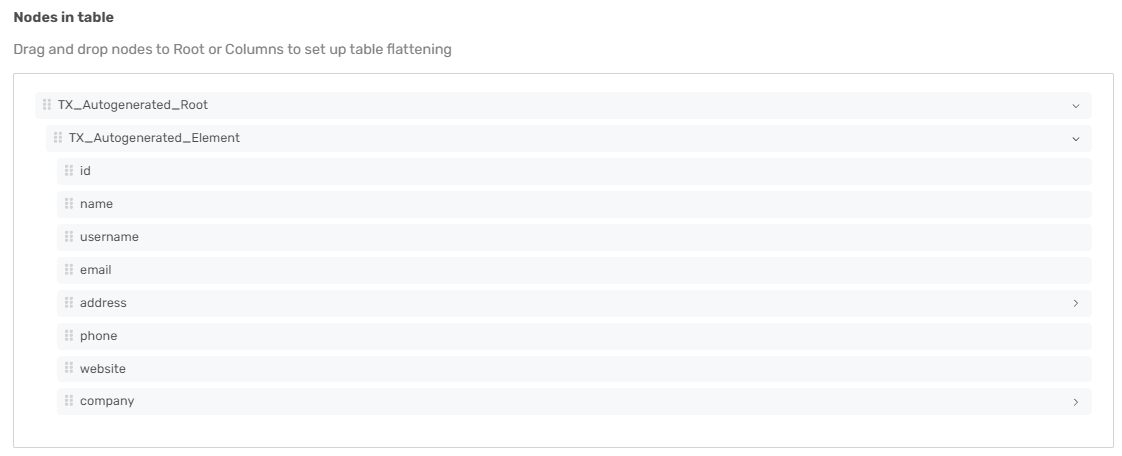
Nodes in table: Here, the schema for your input data is displayed.
Root: This is where in the schema you want to iterate over your data records.
Columns: Here, your selected nodes are dropped from the schema to become the columns in the resulting table.
Output/XSLT: Here, you can toggle between seeing the result of your input data transformed with the generated XSLT and you can also inspect the generated XSLT
Retrieve a JSON or XML output from your REST API source, using one of the following options:
Local File Path: input is any local file path. In case of directory path, it will parse the first file. You need to make sure that the file is either XML or JSON
XML/JSON: Paste valid XML or JSON into the text area
URL (only for XML data source): input is an url that returns a valid XML or JSON content. Please note that authentication settings are not considered for this input method
Current Endpoint (only for REST data sources): Retrieves XML/JSON value from the related endpoint, considering all authentication and dynamic value settings
Click Get schema to retrieve the schema for the JSON or XML in the Input box.
Understanding Root manipulation
The root XPath defines where in the source document your data records iterate. If your data records contain multiple levels of iteration, for example, if your “Employee” records also contain a list of “Phone numbers” for each employee, you can set your root to the XPath of the phone numbers nested iteration level and the table builder will repeat the outside data for each iteration of the root iteration.
Setting the root to “Phone numbers” in the above example will result in the following records (if “Employee Name” and “Phone numbers” is selected as columns:
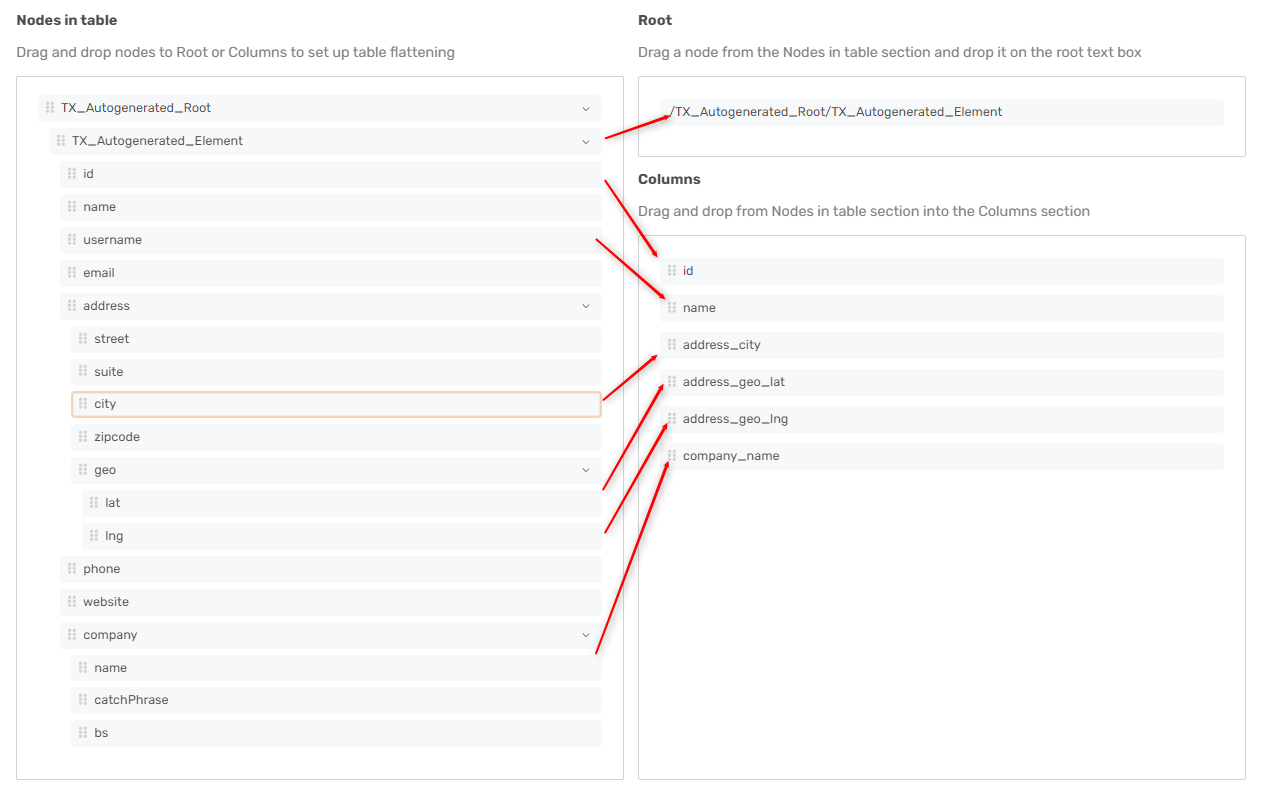
It is important to set the root to the correct level to achieve the desirable transformation. Also, it is useful to set this before you drag and drop nodes into the Column section as the automatic column names are generated relative to the root in the schema hierarchy.
Selecting columns for table creation
Once you have added a table and loaded the structure, the next step is to
Drag and drop nodes from the Nodes in table list to choose the columns for your flattened table. Dragging a “parent” node will add all child leaf nodes to the table.
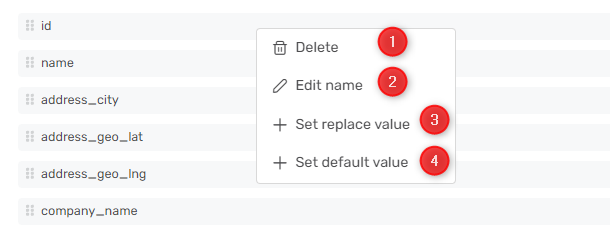
Apply data transformations on the selected nodes in the Columns section by right-clicking on the nodes and selecting:
Delete: Remove the node from the selection
Edit name: Edit the name of the column in the resulting table
Set replace value: A simple string replacement transformation on the values in the column
Set default value: A default value when the column value is a null or empty string.
Click Add static node to add a static column with an appropriate value to your flattened table. You can use dynamic values within all table builder transformations to inject a dynamic value into the table.
Working with different data structures
Currently, there are two options of data structures available in the table builder. The most common one is ‘Generic’. This is when your data structure is verbose, meaning that data points appear as nodes or objects in the data structure.
The other data structure option currently available is ‘Column’. This is when your datapoints reside within arrays or said differently each datapoint contains the values of the entire column in one array.
When working with ‘Column’ based data structures it is important to know that the root will behave differently. Instead of setting where your data iterates, you need to set the root to the parent node of the nodes containing the arrays/columns of data. In the example above, setting the root to “My data” will result in a table containing two columns “My datapoint” and “My datapoint2”.
For column structure to work properly the corresponding arrays of data must be the same length.
Saving and loading settings
After selecting columns and configuring your table, remember to save your settings by clicking Save and close in the table builder modal. The resulting XSLT will be saved along with the selected nodes in the Column section as well as the root XPath. Note that when you save you will overwrite the existing XSLT.
When reopening the table builder, your previously selected root and column nodes will be retained, but you will need to provide new data in the Input section and click Get schema to get nodes in the table. If your loaded nodes in the column section do not have a matching XPath in the nodes in the table schema section, it will be indicated with a red icon. This way you can easily detect schema drift.
We have set up a TimeXtender Enhanced connector for one of our GraphQL API's in the classic TimeXtender version. However, in the classic version we do not have the Table Builder available and thus we cannot use the Table Flattening option (since we don't have an XLST to add). Will the Table Builder be available for TimeXtender Classic version? We will need it in order to change our CData connectors to the Enhanced connector.
This means that rates only contain that and no date explaining what date the rates are from. Between the two there is a TX_Autogenterated_Element_Id field that both tables share, but for this, they will always generate a 0 value. So merging all the endpoints will be impossible.
This is where the table flattening feature can help. It is also explained in the main guide and here, but this is what this is based on.
The setup is generally always the same.
You got the initial first template tag, which looks like this.
The only thing you need to look for is that the xsl:apply-templates tag points at the XPath to where the rates start and the same is the match attribute for the second xsl:template tag. I chose to call the table mixRates so I did not have to check the only list flattened tables option, but you can call it Rates to keep it having the same name.
I removed the majority of available symbols (currency types), so I only got those I wanted.
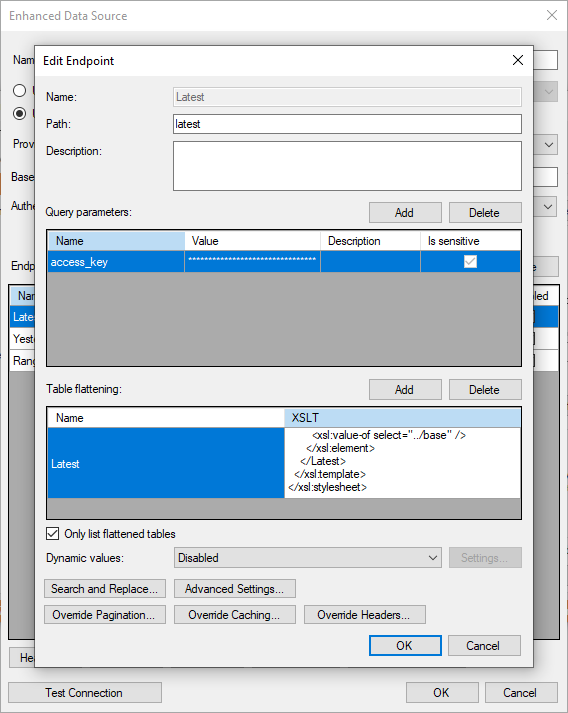
At the bottom, I have added the values missing from the rates table. To connect I use ../ in front of the name. It means select the parent of the current node. I added it like so
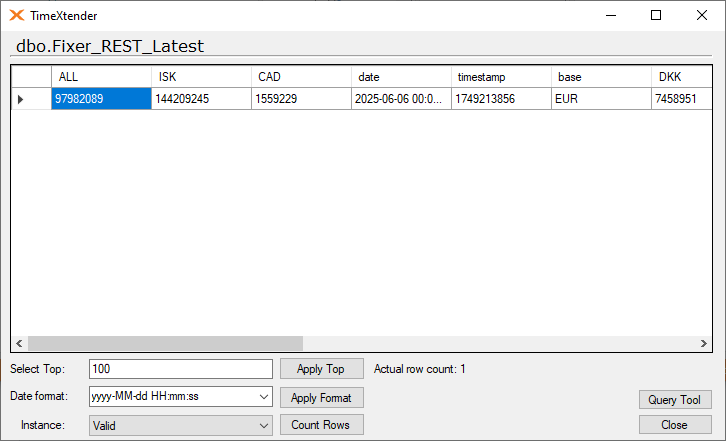
Applying the above XLS code in the XLST field like so will make this Latest table appear.
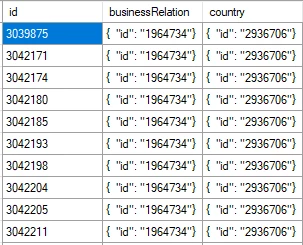
Thank you for the reply. I have tried it and got it to work. However, as I understand correctly, you need to work your way up; the base for your flattened table needs to be the lowest level in the hierarchy. Meaning, if I have a table with a subobject, I take the subobject as the basis for my table. If you have only 1 subobject this is fine, but I have tables with multiple subobjects. Example:
I have a table that contains an id column, and two subobjects; businessRelation and country. If I want to extract this table using a TimeXtender Enhanced connector, I can only choose one subobject for the flattened table? How do I get the above result using table flattening?
You can only choose one root node, so it will have to be one of them. You can still add the fields from the country part if you choose businessRelation.
The issue will be how the data is actually structured.